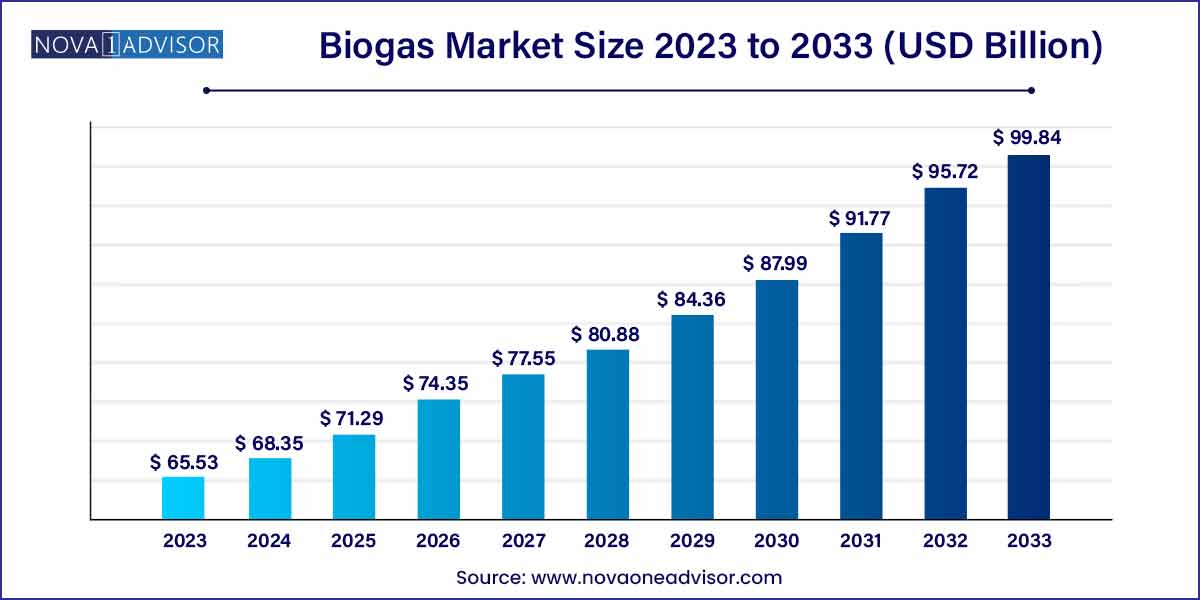
The global biogas market size was exhibited at USD 65.53 billion in 2023 and is projected to hit around USD 99.84 billion by 2033, growing at a CAGR of 4.3% during the forecast period of 2024 to 2033.

Key Takeaways:
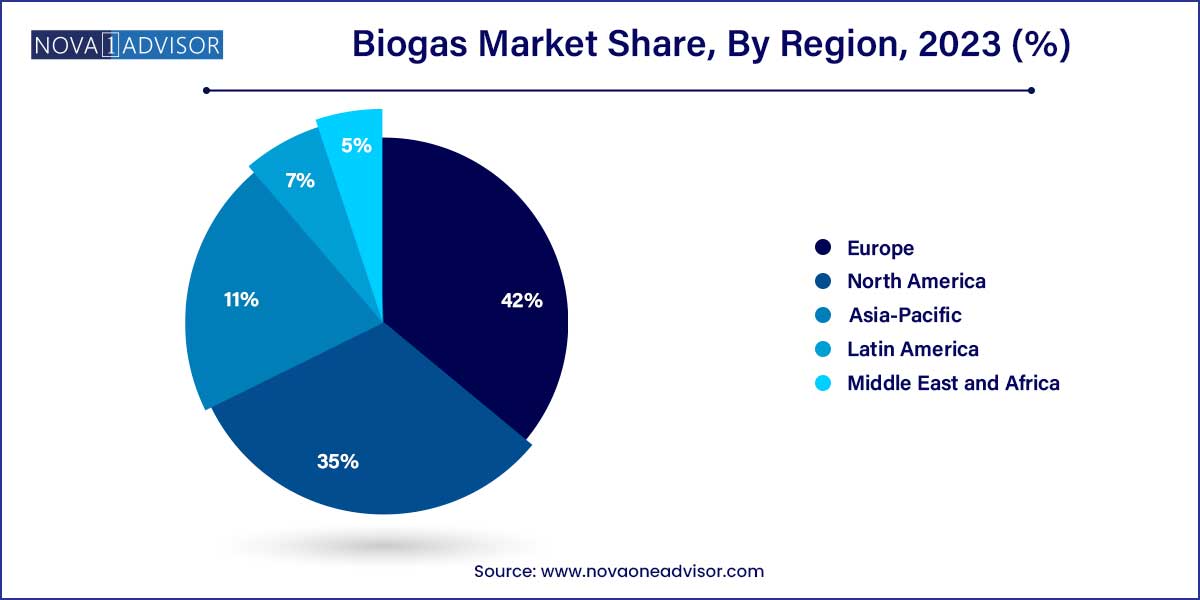
- Europe was the dominant regional segment and accounted for about 42% of revenue share in 2023.
- The electricity application segment led the market and accounted for around 30% of the revenue share in 2023.
- Municipal sources accounted for the largest revenue share of 42.0% in 2023.
Market Overview
The biogas market is evolving as a critical pillar of the global shift towards renewable and sustainable energy systems. Biogas, produced through the anaerobic digestion of organic matter such as agricultural waste, municipal waste, and industrial waste, offers a clean, renewable energy source that reduces greenhouse gas emissions while providing energy security. As of 2025, biogas is increasingly recognized for its ability to contribute to circular economy models, transforming waste into valuable resources and closing material loops.
Governments across the world are encouraging biogas production through favorable policies, subsidies, and targets under climate action plans. European countries, particularly Germany, Sweden, and Denmark, lead the adoption curve, while countries in Asia-Pacific and Latin America are catching up rapidly, driven by rural electrification needs and waste management solutions. The rise of upgraded biogas (biomethane) as a vehicle fuel and a pipeline-injectable substitute for natural gas marks a significant technological and commercial development in the sector.
Despite its promise, the biogas industry faces challenges such as high upfront costs, operational complexities, and policy uncertainties in some regions. However, technological innovations, new business models, and a growing focus on decarbonization across industries are setting the stage for substantial future growth.
Major Trends in the Market
-
Rising Adoption of Upgraded Biogas: The production and use of biomethane, refined to natural gas quality, is growing sharply, particularly for grid injection and vehicle fuel.
-
Integration with Circular Economy Initiatives: Companies are integrating biogas plants into larger waste management and resource recovery ecosystems.
-
Decentralized Energy Production: Small and mid-scale biogas units for communities and farms are increasingly being installed.
-
Public-Private Partnerships (PPPs): Governments are collaborating with private players to fund and operate biogas facilities, especially in developing nations.
-
Technological Advancements: Innovations such as dry anaerobic digestion and high-efficiency biogas upgrading technologies are gaining traction.
-
Focus on Agricultural Waste Utilization: Agricultural residues, manure, and farm waste are becoming key feedstocks for biogas production.
-
Development of Biogas Trading Platforms: Digital marketplaces for trading biogas and biomethane certificates are emerging in Europe.
Biogas Market Report Scope
| Report Coverage |
Details |
| Market Size in 2024 |
USD 65.53 Billion |
| Market Size by 2033 |
USD 99.84 Billion |
| Growth Rate From 2024 to 2033 |
CAGR of 4.3% |
| Base Year |
2023 |
| Forecast Period |
2024-2033 |
| Segments Covered |
Source, Application, Region |
| Market Analysis (Terms Used) |
Value (US$ Million/Billion) or (Volume/Units) |
| Regional Scope |
North America; Europe; Asia Pacific; Central and South America; the Middle East and Africa |
| Key Companies Profiled |
Agrinz Technologies GmbH; Air Liquide; DMT International; Gasum Oy; HomeBiogas Inc; PlanET Biogas; Scandinavian Biogas Fuels International AB; Schmack Biogas Service; Total;Xebec Adsorption Inc. |
Driver: Growing Need for Sustainable Waste Management Solutions
The surge in urbanization, industrialization, and intensive agricultural activities has led to an unprecedented rise in organic waste generation. Traditional waste disposal methods, such as landfilling and incineration, contribute significantly to environmental degradation and greenhouse gas emissions. Biogas offers a sustainable alternative by converting organic waste into energy, thereby addressing two pressing challenges simultaneously: waste management and clean energy production. For instance, Sweden’s waste-to-energy programs utilize biogas facilities extensively to achieve their "zero waste" ambitions. Similarly, India's "SATAT" initiative aims to establish compressed biogas plants across the country, converting agricultural and municipal waste into vehicle-grade fuel. The dual environmental and economic benefits are catalyzing market growth.
Restraint: High Initial Investment and Operational Costs
Despite its long-term benefits, the biogas industry is often hampered by high capital expenditure requirements for setting up plants, purchasing feedstock preprocessing equipment, and installing biogas upgrading technologies. Operating a biogas plant also demands skilled labor, stringent monitoring, and consistent feedstock supply, which can strain project economics. For example, setting up a medium-sized biogas plant capable of producing 500 Nm3/day can cost between $1.5 million to $3 million, depending on technology and location. These costs can deter small-scale farmers, municipalities, and industries, particularly in developing economies, from investing in biogas projects without substantial government subsidies or incentives.
Opportunity: Expanding Role of Biogas in the Transportation Sector
One of the most promising opportunities lies in the increasing use of biogas as a vehicle fuel, especially in the form of compressed biomethane (bio-CNG). As countries and companies pursue net-zero emissions goals, there is a growing demand for clean alternatives to fossil fuels in the transportation sector. Biomethane offers a drop-in solution compatible with existing natural gas vehicle (NGV) infrastructure. In California, for example, the Low Carbon Fuel Standard (LCFS) credits have significantly boosted the economic attractiveness of using renewable natural gas (RNG) as a transport fuel. Similarly, Europe’s "Fit for 55" package envisages a greater role for biomethane in decarbonizing heavy-duty transportation, aviation, and shipping sectors.
Segmental Analysis
By Source
Municipal sources dominated the biogas market in 2024, particularly through landfill gas and municipal wastewater treatment facilities. Landfill gas projects are widespread in developed nations like the U.S. and parts of Europe, where regulatory mandates require landfill operators to control methane emissions. Municipal wastewater biogas recovery systems are also expanding, exemplified by projects like the East Bay Municipal Utility District in California, which uses biogas to meet its electricity needs. The ready availability of feedstock, combined with supportive regulations on waste management and renewable energy, positions municipal sources as the backbone of the global biogas supply chain.
On the other hand, agricultural sources are projected to be the fastest-growing segment over the forecast period. Increasing emphasis on sustainable agriculture and rural development, coupled with funding support for manure management systems, is fueling this growth. For instance, Germany's Renewable Energy Sources Act (EEG) has catalyzed the proliferation of farm-based biogas plants using dairy, poultry, and swine waste. Similarly, initiatives like "AgSTAR" by the U.S. EPA promote the installation of anaerobic digesters on farms. Agricultural residue utilization is gaining traction, presenting farmers with additional income streams and enhancing soil health through the use of digested by-products.
By Application
Electricity generation dominated the application segment of the biogas market, accounting for the lion’s share of revenues in 2024. Biogas-to-electricity projects, ranging from community-sized digesters to large combined heat and power (CHP) plants, are favored for their ability to provide base-load renewable energy. Countries like the United Kingdom, under the Renewable Heat Incentive (RHI) and Feed-in Tariff (FiT) schemes, have seen widespread deployment of electricity-generating biogas plants. Reliability, scalability, and compatibility with existing power grids make electricity generation the primary use of biogas globally.
Conversely, vehicle fuel is anticipated to be the fastest-growing application. The push toward decarbonizing transport, coupled with advancements in upgrading biogas to biomethane, is accelerating its use as a renewable transportation fuel. The "Drive to Zero" initiative, supported by the Global Commercial Vehicle Drive to Zero Program, identifies RNG as a near-term solution for cutting emissions from buses, trucks, and fleets. Moreover, the economic viability of biogas for transport is being bolstered by carbon credits and renewable fuel standards, particularly in North America and Europe.
Regional Analysis
Europe dominated the global biogas market in 2024, driven by robust regulatory frameworks, substantial subsidies, and an overarching commitment to climate neutrality. Countries like Germany, Italy, France, and the UK boast mature biogas industries, supported by policies like the European Green Deal and National Renewable Energy Action Plans. Germany, alone, hosts more than 10,000 biogas plants, with production significantly contributing to its renewable energy mix. The European Union's emphasis on circular economy strategies and waste-to-energy initiatives further cements Europe’s leadership position.

Asia-Pacific is the fastest-growing region in the biogas market. Rapid urbanization, an urgent need for effective waste management, rising energy demands, and supportive governmental initiatives are propelling growth. India, under its "SATAT" (Sustainable Alternative Towards Affordable Transportation) program, aims to set up 5,000 compressed biogas plants by 2030. Meanwhile, China is focusing on rural biogas initiatives to improve living standards and reduce dependence on coal. Technological collaborations, international funding, and government-driven mandates are creating a dynamic and highly promising market landscape in Asia-Pacific.
Some of the prominent players in the biogas market include:
- Agrinz Technologies GmbH
- Air Liquide
- DMT International
- Gasum Oy
- HomeBiogas Inc.
- PlanET Biogas
- Scandinavian Biogas Fuels International AB
- Schmack Biogas Service
- Total
- Xebec Adsorption Inc.
Recent Developments
-
April 2025: Bright Biomethane announced the commissioning of a new biomethane upgrading facility in Denmark, capable of injecting 3 million Nm3 of biomethane annually into the grid.
-
March 2025: Engie announced the launch of its largest biomethane production unit in France, supporting the "Plan Biogaz" initiative to double national biomethane capacity by 2030.
-
February 2025: Clean Energy Fuels signed an agreement with Amazon to supply renewable natural gas (RNG) for its growing fleet of vehicles.
-
January 2025: Waga Energy secured contracts to deploy landfill gas-to-biomethane upgrading units across Canada, expanding its footprint in North America.
-
December 2024: EnviTec Biogas AG expanded its presence in Southeast Asia by establishing a joint venture in Vietnam, focusing on agricultural waste-to-biogas projects.
Segments Covered in the Report
This report forecasts revenue growth at global, regional, and country levels and provides an analysis of the latest industry trends in each of the sub-segments from 2021 to 2033. For this study, Nova one advisor, Inc. has segmented the global biogas market.
Source
-
- Dairy
- Poultry
- Swine Farm
- Agricultural Residue
Application
- Vehicle Fuel
- Electricity
- Heat
- Upgraded Biogas
- Cooking Gas
By Region
- North America
- Europe
- Asia-Pacific
- Latin America
- Middle East & Africa (MEA)


