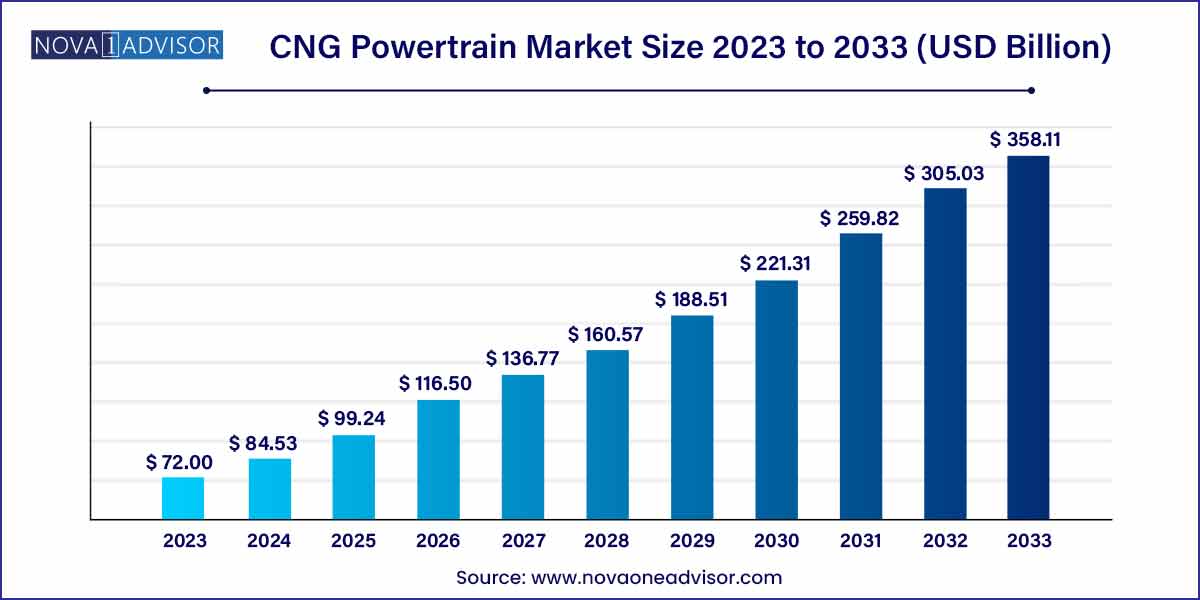
The global CNG powertrain market size was exhibited at USD 72.0 billion in 2023 and is projected to hit around USD 358.11 billion by 2033, growing at a CAGR of 17.4% during the forecast period of 2024 to 2033.

Key Takeaways:
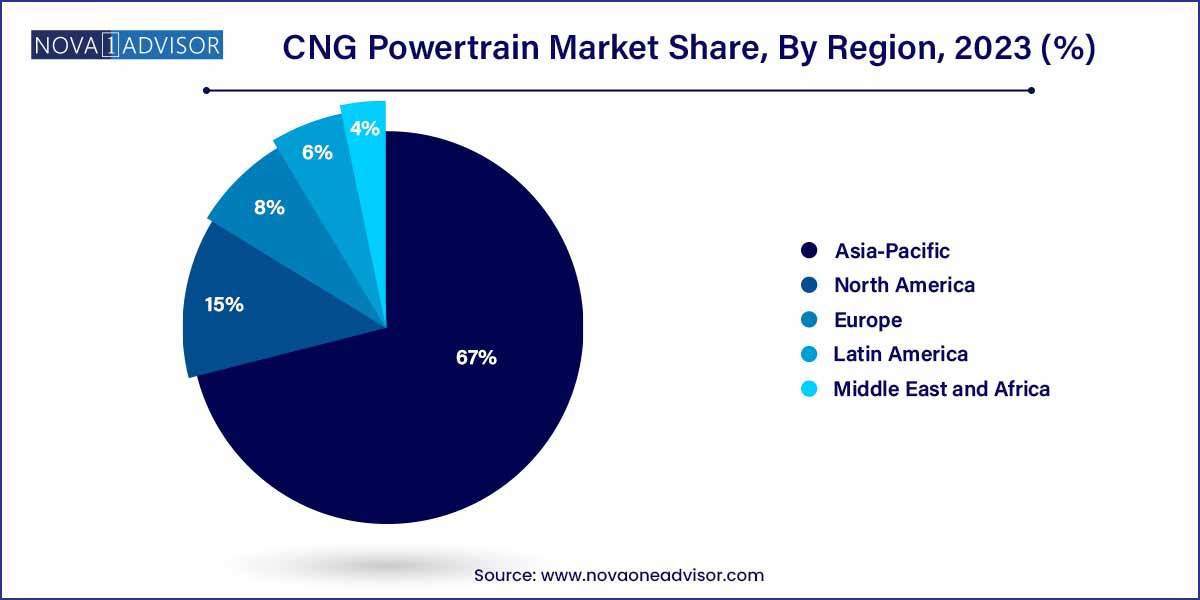
- Asia Pacific dominated the market in 2023 and accounted for over 67.0% of the share, owing to the rapid growth in the automobile sector in countries such as China and India.
- The front-wheel-drive segment dominated the overall market in 2023 and accounted for a revenue share of over 50.0%.
- Bi-fuel dominated the overall market in 2023 and accounted for a revenue share of over 80.0%.
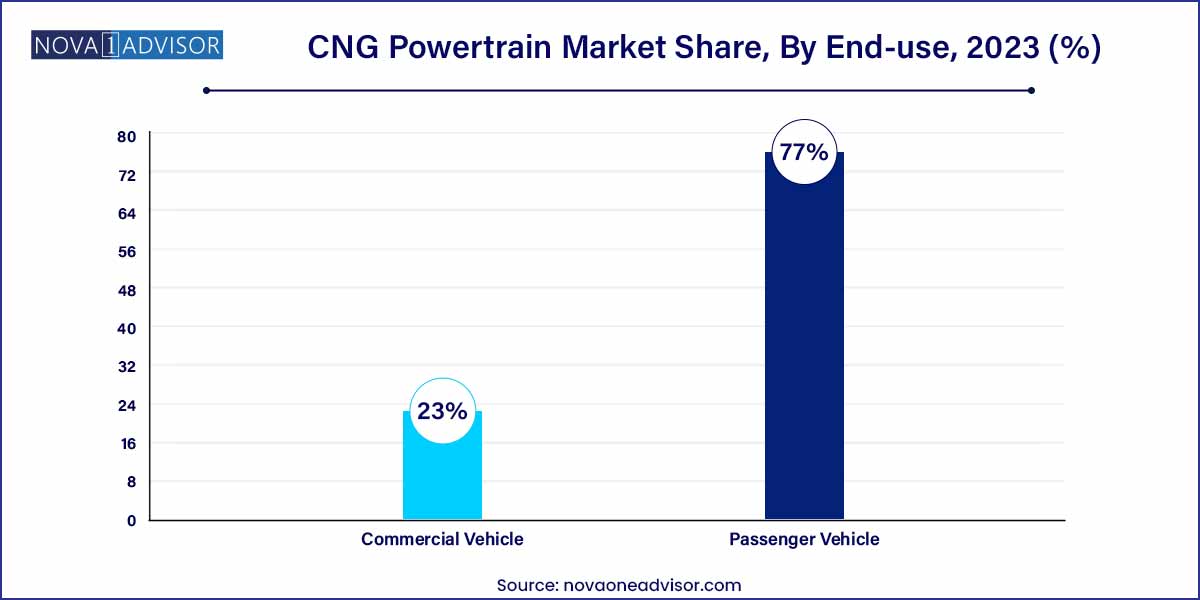
- The passenger vehicle segment accounted for more than 77.0% of the overall revenue in 2023.
Market Overview
The Compressed Natural Gas (CNG) powertrain market represents a critical evolution in the pursuit of cleaner, more cost-efficient alternatives to traditional internal combustion engines (ICEs). Leveraging the environmental and economic advantages of natural gas, CNG powertrains offer a transitional solution toward low-emission transportation, especially in regions where full electrification remains economically or infrastructurally unfeasible.
CNG vehicles are powered by a modified version of a conventional internal combustion engine. These vehicles either operate solely on CNG (mono-fuel) or feature dual-fuel (bi-fuel) systems that allow switching between gasoline and CNG. The powertrain includes specific adaptations such as reinforced fuel tanks, injectors, regulators, and combustion chambers designed to manage CNG's high pressure and different combustion properties.
The market's growth is supported by several converging trends: heightened air pollution regulations, volatile gasoline and diesel prices, and the increasing availability of natural gas infrastructure. Many governments are incentivizing CNG vehicle adoption through tax benefits, purchase subsidies, and favorable regulatory frameworks, particularly for commercial fleets and public transportation systems.
Additionally, advancements in CNG storage technology and engine optimization are improving vehicle performance and driving range, making them more competitive with conventional fuel systems. As original equipment manufacturers (OEMs) and aftermarket integrators expand their offerings, the global CNG powertrain market is expected to witness steady and strategic growth across both developed and emerging economies.
Major Trends in the Market
-
Rising Demand for Bi-fuel Powertrains: Consumers are favoring bi-fuel vehicles for flexibility and extended range across passenger and light commercial segments.
-
Government Incentives for Cleaner Transport: Policy-driven programs in India, Italy, and Iran are spurring OEM CNG vehicle sales.
-
CNG Retrofitting Solutions Gaining Ground: A growing aftermarket for vehicle conversion kits is emerging, particularly in Latin America and Southeast Asia.
-
Expansion of CNG Refueling Infrastructure: Public and private investments in filling stations are supporting market scalability.
-
Cost Advantage Over Gasoline and Diesel: CNG offers significant per-mile savings, particularly for high-mileage fleets and taxis.
-
Technological Advancements in Tank Materials: Lightweight composite tanks are improving safety, storage efficiency, and vehicle design flexibility.
-
OEM Focus on Light Commercial Vehicles (LCVs): Automakers are launching more CNG-compatible LCVs for urban logistics and delivery fleets.
-
Sustainable CNG Options Emerging: Renewable natural gas (RNG or biomethane) is being blended into CNG networks in Europe and North America, reducing lifecycle emissions.
CNG Powertrain Market Report Scope
| Report Coverage |
Details |
| Market Size in 2024 |
USD 72.0 Billion |
| Market Size by 2033 |
USD 358.11 Billion |
| Growth Rate From 2024 to 2033 |
CAGR of 17.4% |
| Base Year |
2023 |
| Forecast Period |
2024-2033 |
| Segments Covered |
Drive Type, Fuel Type, Vehicle Type, Region |
| Market Analysis (Terms Used) |
Value (US$ Million/Billion) or (Volume/Units) |
| Regional Scope |
North America; Europe; Asia Pacific; Central and South America; the Middle East and Africa |
| Key Companies Profiled |
Cummins Inc.; AB Volvo; Robert Bosch GmbH; FPT Industrial S.P.A.; Ford Motor Company. |
Market Driver: Environmental Regulations and Urban Emission Control Initiatives
One of the most powerful drivers of the CNG powertrain market is the tightening of emission norms and urban air quality control mandates across key global markets. Cities worldwide are experiencing escalating environmental and public health challenges due to vehicular emissions, prompting governments to search for lower-emission transport alternatives. CNG vehicles offer significantly lower tailpipe emissions of nitrogen oxides (NOx), sulfur dioxide (SO2), and particulate matter (PM) compared to their diesel or gasoline counterparts.
Major metropolitan regions—from Delhi and Mumbai in India to Milan in Italy and Tehran in Iran—have implemented clean vehicle incentives or outright bans on diesel fleets in congested urban zones. In such contexts, CNG offers a cost-effective and scalable solution, particularly for high-mileage users like buses, taxis, and delivery fleets. The relatively lower greenhouse gas emissions of CNG, especially when blended with renewable sources, also align with the carbon neutrality goals set by the EU Green Deal and the U.S. Clean Energy Plan.
Market Restraint: Infrastructure Limitations and Range Anxiety
A major restraint in the CNG powertrain market is the limited availability of CNG refueling infrastructure, especially in developing economies and rural areas. Unlike gasoline or diesel, which are universally available, CNG requires high-pressure refueling stations equipped with compressors, pipelines, and specialized safety systems. The lack of adequate infrastructure can discourage adoption, particularly for consumers not based in metro areas with reliable station networks.
In addition, CNG vehicles often have shorter driving ranges compared to gasoline or diesel vehicles, especially mono-fuel variants. While bi-fuel systems mitigate this concern to an extent, they also increase vehicle complexity and cost. Range anxiety remains a concern for individual car buyers and commercial fleet operators, particularly in countries where long-distance routes lack CNG station coverage. Addressing these limitations will require sustained investment and policy alignment to encourage private-public partnerships in refueling infrastructure development.
Market Opportunity: Integration with Renewable Natural Gas (RNG) and Bio-CNG
A significant market opportunity lies in the integration of Renewable Natural Gas (RNG)—also known as biomethane or bio-CNG—into existing CNG fueling networks. RNG is derived from organic waste such as agricultural residues, municipal solid waste, and landfill gas. It offers an ultra-low or even carbon-negative alternative to fossil-derived natural gas when life-cycle emissions are considered.
Europe, in particular, has taken the lead in promoting RNG. Countries like Sweden, Germany, and the Netherlands are now feeding bio-CNG into their transport networks, creating new demand for carbon-neutral CNG vehicles. In the U.S., California’s Low Carbon Fuel Standard (LCFS) has promoted RNG integration through credit mechanisms that reward low-carbon fuel usage.
For fleet operators and municipalities aiming to decarbonize their operations without switching to battery-electric vehicles, RNG presents an ideal transitional solution. Contracting CNG vehicles with guaranteed RNG supply can meet both operational and sustainability goals, opening new revenue and partnership streams for CNG powertrain providers.
By Drive Type Insights
Front-wheel drive (FWD) CNG powertrains dominate the market, especially in the passenger vehicle and light commercial vehicle segments. FWD configurations are typically more compact, cost-efficient, and compatible with the architectural layout of smaller sedans, hatchbacks, and light vans. As these vehicle types represent the bulk of urban and fleet CNG adoption in densely populated countries like India, China, and Iran, FWD continues to lead in market share. Moreover, FWD vehicles offer better fuel economy, which complements the cost-saving value proposition of CNG powertrains for budget-conscious users.
However, all-wheel drive (AWD) configurations are the fastest-growing, as manufacturers begin to offer CNG variants of SUVs and crossovers. With consumer interest shifting toward utility vehicles globally, OEMs are exploring AWD compatibility in dual-fuel CNG variants. Although the mechanical complexity of integrating AWD with CNG storage systems poses challenges, growing demand in European and North American markets, particularly for eco-friendly utility vehicles, is expected to accelerate this segment’s growth through 2034.
By Fuel Type Insights
Bi-fuel vehicles dominate the market, as they offer the flexibility of switching between gasoline and CNG, eliminating range anxiety and allowing drivers to refuel wherever conventional fuel stations exist. This flexibility has made bi-fuel systems particularly popular in countries like Brazil, Argentina, and India, where CNG infrastructure is expanding but not yet ubiquitous. Consumers value the backup of a gasoline tank, especially for long trips outside urban centers. Bi-fuel systems are also easier to retrofit, making them popular in the aftermarket segment.
Conversely, mono-fuel CNG vehicles are growing fastest, particularly in the commercial fleet segment. Mono-fuel powertrains are optimized solely for CNG, providing better performance, engine tuning, and emissions efficiency. Many municipal bus services, taxi fleets, and logistics providers prefer mono-fuel systems due to simplified maintenance, fuel cost savings, and bulk fuel contracts. OEMs like Tata Motors, Iveco, and Dongfeng are launching purpose-built mono-fuel CNG trucks and buses, supporting strong growth in this sub-segment.
By Vehicle Type Insights
Passenger vehicles hold the largest share of the CNG powertrain market, driven by cost-sensitive consumer segments in Asia-Pacific, Latin America, and parts of Europe. In densely populated cities with poor air quality and growing congestion, CNG-powered hatchbacks and sedans are promoted by governments and ride-hailing platforms alike. OEMs like Maruti Suzuki, Hyundai, and Fiat have introduced factory-fitted CNG variants in popular city car models, enabling easy adoption and growing customer trust in these systems.

However, commercial vehicles are the fastest-growing segment, fueled by rising diesel prices, emission regulations, and e-commerce-driven logistics growth. CNG-powered light-duty trucks, delivery vans, and city buses are being rapidly deployed by fleet operators. For example, Delhi’s public transport fleet is predominantly CNG-based, and logistics giants like UPS and FedEx have adopted CNG trucks in several U.S. cities. The combination of lower operational costs and growing infrastructure availability is expected to accelerate CNG penetration in commercial fleets worldwide.
By Regional Insights
Asia-Pacific leads the global CNG powertrain market, owing to government-led initiatives, large urban populations, and high vehicle usage rates. Countries like India, Pakistan, China, and Indonesia are rapidly adopting CNG powertrains to curb air pollution and reduce reliance on imported oil. India is particularly dominant, with its CNG vehicle population expected to cross 10 million by 2030. Cities like Delhi, Mumbai, and Ahmedabad have built extensive CNG refueling networks, and government subsidies make factory-fitted CNG cars highly attractive to urban commuters and taxi services.
China has also witnessed strong CNG adoption in the western provinces and for long-haul commercial vehicles. With Beijing investing in both LNG and CNG for clean transport, and local OEMs developing dedicated CNG platforms, the region’s dominance is expected to continue. Domestic manufacturers, as well as international OEMs operating in the region, benefit from favorable policies, rising fuel costs, and a large addressable market.

Latin America is the fastest-growing regional market, driven by robust CNG penetration in countries like Argentina, Brazil, and Colombia. Argentina is a pioneer, with over 2.3 million CNG vehicles and a well-established network of refueling stations. Government incentives, tax reductions, and subsidies for vehicle conversion have helped CNG gain significant momentum. Brazil’s São Paulo and Rio de Janeiro regions have also seen increased CNG adoption in taxis and delivery vans.
What makes Latin America unique is its strong retrofitting market, where aftermarket players convert gasoline vehicles to CNG at scale. This dynamic is enabling rapid, decentralized growth even in the absence of full OEM support. As more economies in the region look to reduce fuel import costs and environmental emissions, investment in CNG infrastructure and vehicle conversion is expected to grow steadily, cementing the region’s position as a growth hotspot.
Some of the prominent players in the CNG powertrain market include:
- Cummins Inc.
- AB Volvo
- Robert Bosch GmbH.
- FPT Industrial S.P.A.
- Ford Motor Company
- Maruti Suzuki India Limited
- Volkswagen AG
- Hyundai Motor Company
- Nissan Motor Co., Ltd.
- Honda Motor Company
Segments Covered in the Report
This report forecasts revenue growth at global, regional, and country levels and provides an analysis of the latest industry trends in each of the sub-segments from 2021 to 2033. For this study, Nova one advisor, Inc. has segmented the global CNG powertrain market.
Drive Type
- All-wheel Drive
- Rear Wheel Drive
- Front Wheel Drive
Fuel Type
Vehicle Type
- Passenger Vehicle
- Commercial Vehicle
By Region
- North America
- Europe
- Asia-Pacific
- Latin America
- Middle East & Africa (MEA)


