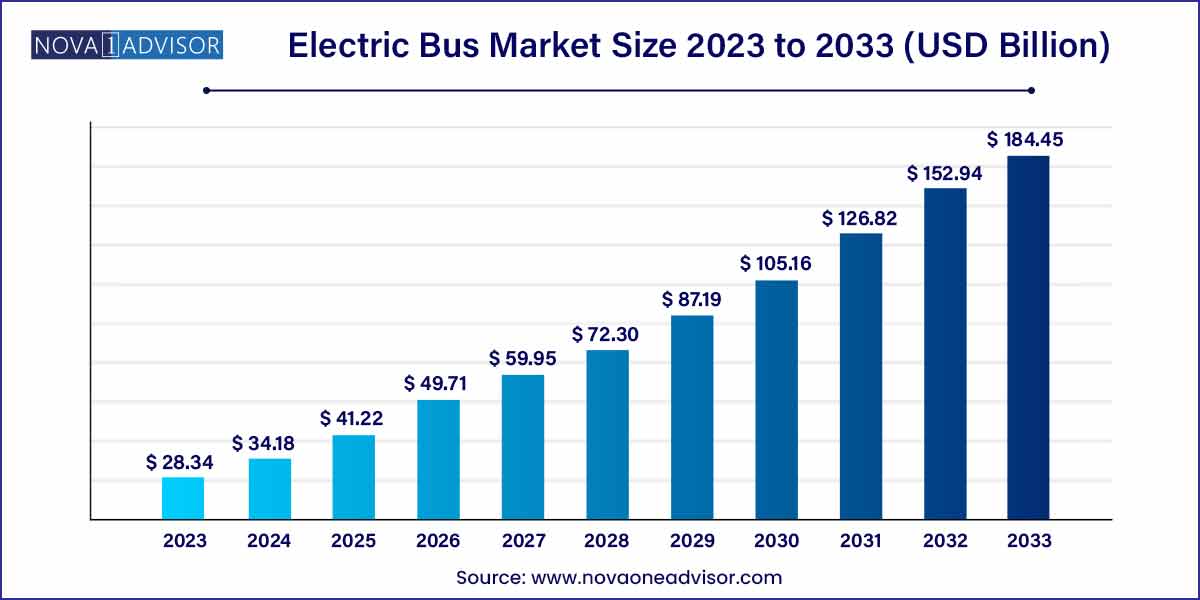
The global electric bus market size was exhibited at USD 28.34 billion in 2023 and is projected to hit around USD 184.45 billion by 2033, growing at a CAGR of 20.6% during the forecast period of 2024 to 2033.

Key Takeaways:
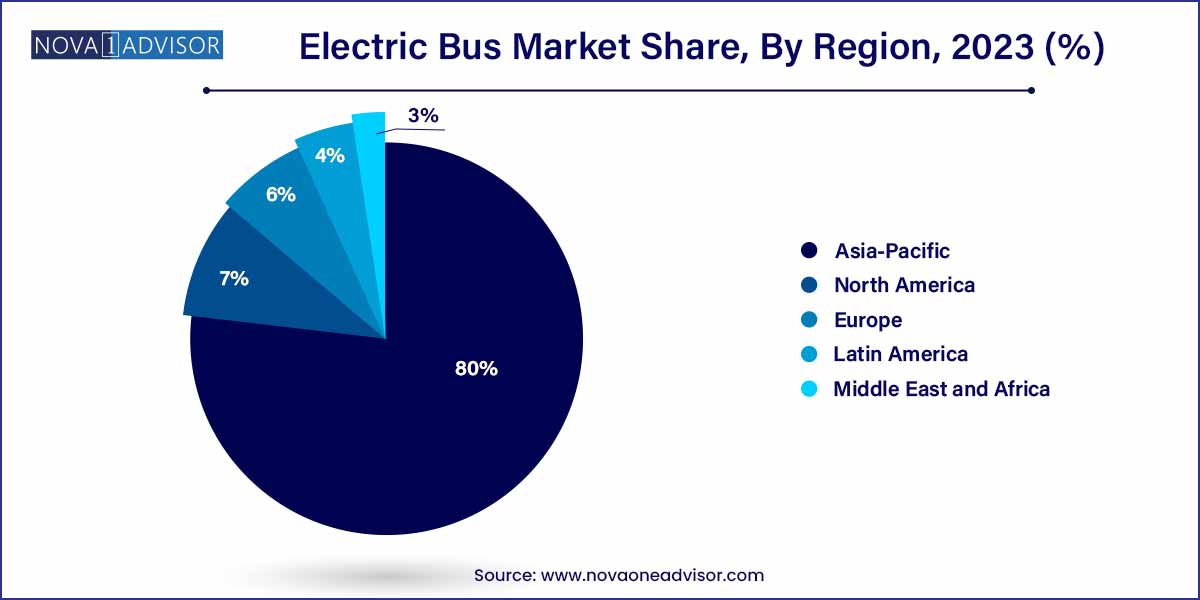
- The Asia-Pacific region held the highest market share of more than 80% in the electric bus industry in 2023.
- The BEV segment dominated the electric bus industry with a share of more than 65% in 2023.
- The lithium-ion-phosphate battery segment dominated the market with a market share of more than 90% in 2023.
- The intercity segment dominates the overall market and will hold a market share of more than 90% in 2023.
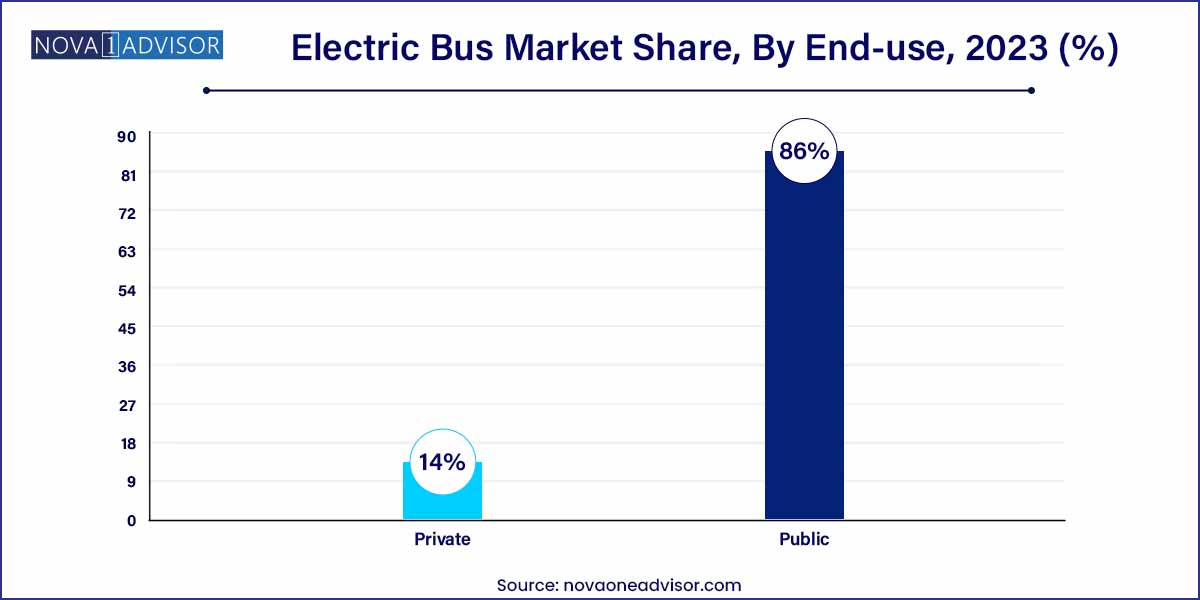
- The public segment held the highest market share of more than 86% of the global electric bus industry in 2023.
Electric Bus Market: Overview
The Electric Bus Market has emerged as a critical component in the transition toward sustainable urban transportation solutions. With growing concerns about air pollution, climate change, and fuel dependency, electric buses (e-buses) offer a promising alternative to traditional diesel-powered public and private transport systems. Powered by advanced battery technologies or fuel cells, electric buses provide substantial benefits, including reduced greenhouse gas emissions, lower noise pollution, and lower operating costs over time.
Governments worldwide are implementing stringent emission regulations and offering subsidies to encourage fleet electrification. Additionally, major transit authorities are increasingly adopting electric buses to meet net-zero emission goals. The global market is fueled by advancements in battery technology, improvements in charging infrastructure, and increasing investments by public and private sector players. Companies like BYD, Proterra, Yutong, and Volvo Buses are leading innovation, pushing the boundaries of range, efficiency, and affordability in the electric bus segment.
As smart cities grow and urban populations expand, the demand for cleaner, more efficient public transportation is set to skyrocket, making electric buses an essential pillar of future mobility solutions.
Electric Bus Market Growth
The growth of the electric bus market is propelled by several key factors. Firstly, heightened environmental concerns and stringent regulations aimed at reducing carbon emissions are compelling transit agencies and fleet operators to adopt electric buses as a sustainable alternative. Additionally, the substantial operational cost savings offered by electric buses, including lower fuel expenses and reduced maintenance requirements, are driving their adoption as a financially attractive option. Furthermore, increasing public awareness of environmental issues and a preference for cleaner transportation modes are fueling demand for electric buses among passengers, further incentivizing transit agencies to integrate them into their fleets. Moreover, technological advancements in battery technology, coupled with supportive government policies and investments, are facilitating the growth of the electric bus market, paving the way for a greener and more sustainable urban transportation landscape.
Electric Bus Market Report Scope
| Report Coverage |
Details |
| Market Size in 2024 |
USD 28.34 Billion |
| Market Size by 2033 |
USD 184.45 Billion |
| Growth Rate From 2024 to 2033 |
CAGR of 20.6% |
| Base Year |
2023 |
| Forecast Period |
2024-2033 |
| Segments Covered |
Vehicle Type, Battery Type, Application, End-use, Region |
| Market Analysis (Terms Used) |
Value (US$ Million/Billion) or (Volume/Units) |
| Regional Scope |
North America; Europe; Asia Pacific; Central and South America; the Middle East and Africa |
| Key Companies Profiled |
BYD Company Limited; AB Volvo; Proterra Solaris Bus & Coach S.A.; Man Se; Nissan Motor Corporation; Ashok Leyland Limited; Daimler Truck AG; Zhengzhou Yutong Bus Co., Ltd.; TATA Motors Limited; Hyundai Motor Company |
Electric Bus Market Dynamics
- Environmental Regulations and Sustainability Initiatives:
Government regulations aimed at reducing carbon emissions and combating air pollution are driving the adoption of electric buses. Environmental concerns have led many cities and regions to implement strict emission standards, incentivizing transit agencies and fleet operators to transition to electric buses to comply with regulatory requirements. Additionally, sustainability initiatives by governments and organizations worldwide are pushing for the electrification of public transportation as part of broader efforts to mitigate climate change and improve air quality. As a result, the electric bus market is experiencing significant growth as demand for clean and sustainable transportation solutions continues to rise.
- Technological Advancements and Cost Competitiveness:
Technological advancements in battery technology, charging infrastructure, and electric drivetrains are driving the growth of the electric bus market. Improved energy density, longer battery life, and faster charging capabilities are enhancing the performance and range of electric buses, making them more viable for urban transit operations. Moreover, economies of scale and increased competition in the electric vehicle market are driving down costs, making electric buses more cost-competitive with traditional diesel buses over their lifecycle. As a result, transit agencies and fleet operators are increasingly considering electric buses as a financially attractive option, further fueling market growth and innovation.
Electric Bus Market Restraint
- High Initial Capital Costs:
One of the primary restraints hindering the widespread adoption of electric buses is the high initial capital costs associated with purchasing electric bus fleets and establishing charging infrastructure. While electric buses offer long-term operational cost savings compared to traditional diesel buses, the upfront investment required for procurement and infrastructure development can pose a significant barrier for transit agencies and fleet operators, especially those with limited financial resources.
- Limited Charging Infrastructure and Range Anxiety:
Another key restraint facing the electric bus market is the limited availability of charging infrastructure and concerns related to range anxiety. Unlike traditional fossil fuel-powered buses, electric buses require access to charging stations to recharge their batteries, which can pose logistical challenges, especially in areas with inadequate charging infrastructure. Additionally, concerns about the range and battery life of electric buses may deter transit agencies from fully embracing electrification, particularly for routes with longer distances or variable schedules.
Electric Bus Market Opportunity
- Growth Potential in Emerging Markets:
Emerging markets present significant growth opportunities for the electric bus market. Rapid urbanization, increasing population density, and escalating environmental concerns in emerging economies are driving demand for sustainable transportation solutions. Governments in these regions are increasingly investing in public transit infrastructure and incentivizing the adoption of electric buses through subsidies, tax incentives, and regulatory mandates. As a result, there is a growing market potential for electric buses in countries across Asia, Latin America, and Africa, where urbanization rates are high, and air pollution levels are a growing concern.
- Integration with Smart City Initiatives:
The integration of electric buses with smart city initiatives presents another significant opportunity for market growth. Smart city projects focus on leveraging technology and data-driven solutions to improve urban mobility, enhance energy efficiency, and reduce environmental impact. Electric buses play a crucial role in these initiatives by offering a cleaner, quieter, and more sustainable mode of public transportation. By integrating electric buses with smart city infrastructure, such as intelligent transportation systems, real-time monitoring, and predictive maintenance solutions, cities can optimize bus operations, improve passenger experience, and reduce overall transportation-related emissions.
Electric Bus Market Challenges
- Infrastructure Limitations and Grid Capacity:
A significant challenge for the widespread adoption of electric buses is the inadequate charging infrastructure and grid capacity to support large-scale electrification of bus fleets. Establishing charging stations, especially fast-charging infrastructure, requires substantial investment and coordination among various stakeholders, including transit agencies, utilities, and government entities. Additionally, upgrading the electrical grid to accommodate the increased demand from electric buses can pose logistical and financial challenges.
- Technological Limitations and Battery Performance:
Technological limitations and battery performance issues remain significant challenges in the electric bus market. While advancements in battery technology have improved the energy density, lifespan, and charging capabilities of batteries, challenges such as limited range, degradation over time, and high costs persist. Electric buses operating in demanding urban environments with frequent stop-and-go traffic and varying weather conditions may experience accelerated battery degradation, reducing overall vehicle performance and reliability. Moreover, concerns about battery safety, thermal management, and recycling also pose challenges for electric bus manufacturers and operators.
Segments Insights:
Vehicle Type Insights
Battery Electric Vehicles (BEVs) dominated the vehicle segment in 2024. BEVs are widely preferred for intracity transport due to their zero emissions, operational cost savings, and growing availability of charging infrastructure. Governments are primarily subsidizing BEVs, making them more affordable for transit agencies. Companies like BYD and Proterra have achieved significant milestones in delivering thousands of battery electric buses across North America, Europe, and Asia.
Fuel Cell Electric Vehicles (FCEVs) are the fastest-growing vehicle type. FCEVs are gaining momentum, particularly for long-range intercity transportation and heavy-duty transit routes where BEVs face range limitations. In April 2024, Ballard Power Systems expanded its partnership with Solaris to deliver hydrogen-powered buses in Germany, showcasing the increasing interest in FCEV technology for extended operational needs.
Battery Type Insights
Lithium Iron Phosphate (LFP) batteries dominated the battery segment in 2024. Known for their thermal stability, longer lifecycle, and cost-effectiveness, LFP batteries have become the go-to choice for electric bus manufacturers, particularly in China and other Asian markets. BYD, a leader in LFP battery-powered buses, has capitalized on this trend by promoting safe, durable, and efficient solutions for mass transit.
Lithium Nickel Manganese Cobalt Oxide (NMC) batteries are witnessing faster adoption. NMC batteries offer higher energy density, enabling longer driving ranges on a single charge, which is crucial for intercity operations. Manufacturers targeting European and North American markets are increasingly favoring NMC chemistry for premium electric buses aimed at extending service coverage.
Application Insights
Intracity buses dominated the application segment. Urban public transportation is the primary target for electric bus deployment, where short, predictable routes and frequent stops make BEVs and FCEVs highly viable. Major cities such as London, Shenzhen, and Los Angeles have integrated large fleets of electric buses to curb urban air pollution and meet sustainability targets.
Intercity buses are the fastest-growing application. With improvements in battery range, charging infrastructure, and fuel cell technology, intercity electric buses are becoming feasible. Companies are now designing electric coaches for medium to long-haul routes, and governments are beginning to subsidize these as part of broader climate initiatives. In 2024, FlixBus announced pilot tests of long-distance electric buses across Europe, indicating rapid evolution in this segment.
End-Use Insights
Public sector use dominated the end-use segment. Governments and municipal agencies are leading the adoption of electric buses to meet public transit needs, supported by grants, low-interest financing, and policy mandates. Major transit agencies globally have announced electrification targets, such as New York's MTA aiming for a fully electric fleet by 2040.

Private sector deployment is rapidly growing. Private operators, including airport shuttle services, corporate fleets, and ride-hailing companies, are embracing electric buses to reduce their carbon footprint and capitalize on operational cost savings. In January 2024, Amazon expanded its order of electric delivery shuttles, marking a notable shift towards private investment in electric mass mobility.
Regional Insights
Asia-Pacific dominated the global electric bus market in 2024. China remains the undisputed leader, accounting for over 90% of the world's electric bus fleet, thanks to aggressive government policies, heavy subsidies, and a mature supply chain. Cities like Shenzhen have achieved full electrification of their public bus fleets. Besides China, countries like India and South Korea are ramping up efforts under initiatives like India's FAME II scheme, further strengthening Asia-Pacific's leadership position.

Europe is the fastest-growing region. The European Union's commitment to carbon neutrality, stringent emission standards, and substantial investments in EV infrastructure are driving rapid growth. Nations such as Germany, the Netherlands, and the UK are witnessing a surge in electric bus deployments. In February 2024, the European Commission approved a €1 billion investment package for electric bus infrastructure across member states, underlining Europe's robust growth trajectory.
Some of the prominent players in the electric bus market include:
- BYD Company Limited
- AB Volvo
- Proterra
- Man Se
- Nissan Motor Corporation
- Ashok Leyland Limited
- Daimler Truck AG
- Zhengzhou Yutong Bus Co., Ltd.
- TATA Motors Limited
- Hyundai Motor Company
Segments Covered in the Report
This report forecasts revenue growth at global, regional, and country levels and provides an analysis of the latest industry trends in each of the sub-segments from 2021 to 2033. For this study, Nova one advisor, Inc. has segmented the global electric bus market.
Vehicle
- Battery Electric Vehicle
- Plug-in Hybrid Electric Vehicle
- Fuel Cell Electric Vehicle
Battery
- Lithium Nickel Manganese Cobalt Oxide
- Lithium Iron Phosphate
Application
End-use
By Region
- North America
- Europe
- Asia-Pacific
- Latin America
- Middle East & Africa (MEA)


