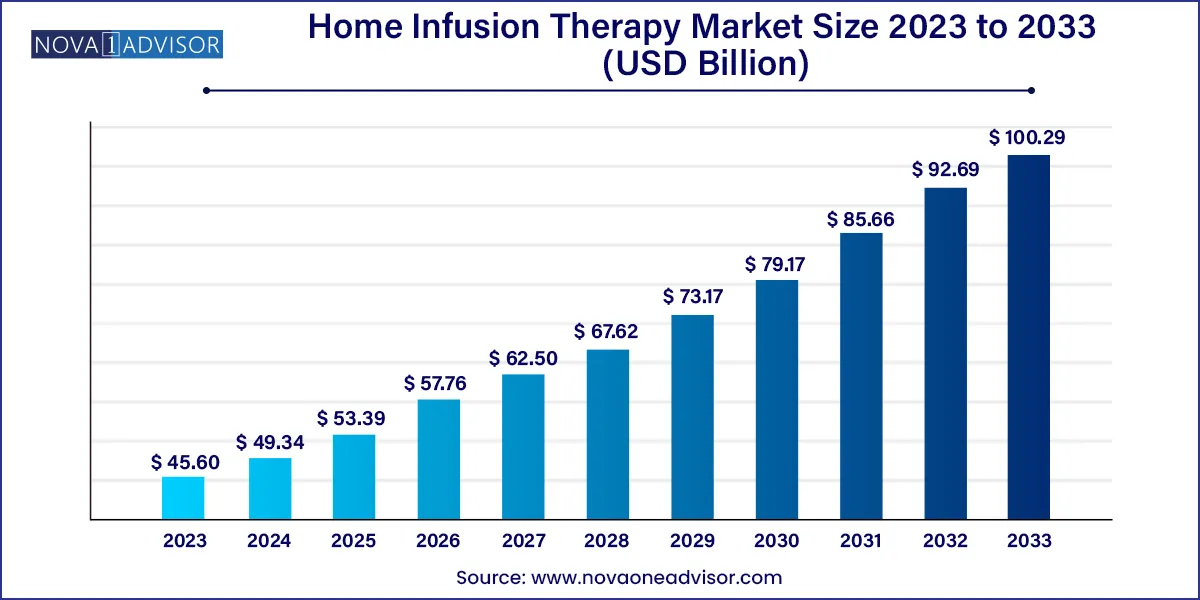
The global home infusion therapy market size was valued at USD 45.60 billion in 2023 and is projected to surpass around USD 100.29 billion by 2033, registering a CAGR of 8.2% over the forecast period of 2024 to 2033.

Key Takeaways:
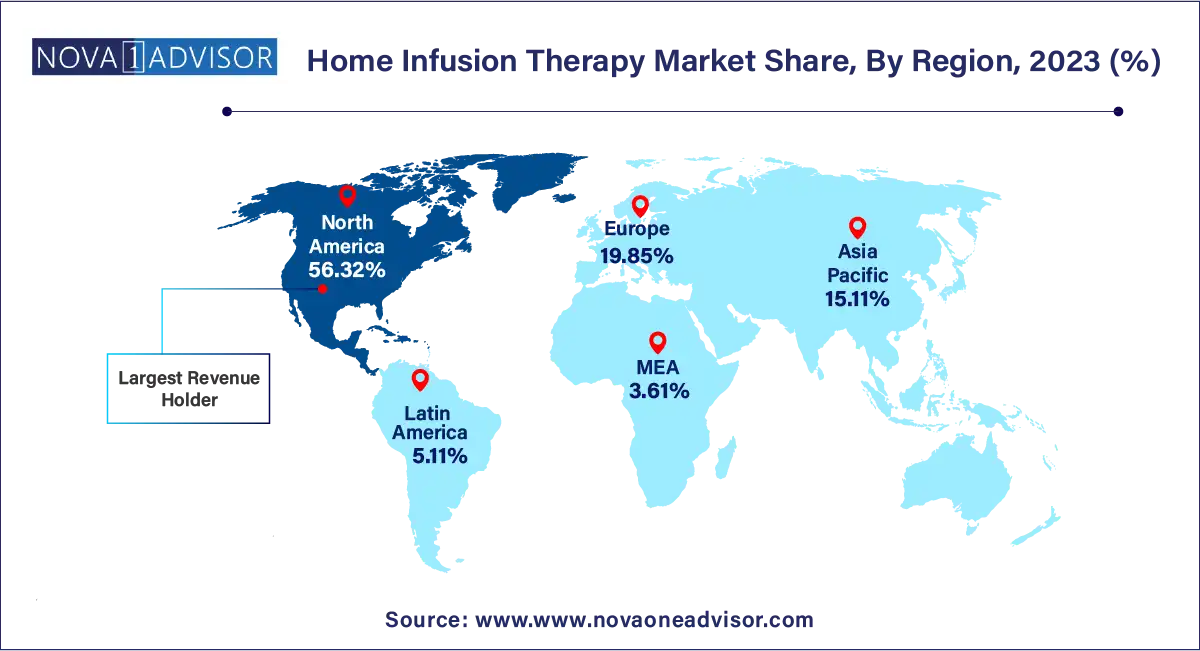
- North America dominated the market in 2023 with a revenue share of over 56.32% and this trend is expected to continue throughout the forecast period.
- The Asia Pacific market is expected to register the fastest CAGR over the forecast period.
- The infusion pumps segment accounted for the largest revenue share of over 51.13% in 2023.
- Needleless connectors are anticipated to register the highest CAGR over the forecast period.
- The anti-infective segment dominated the market for home infusion therapy in 2023 with a revenue share of over 26.19%.
- Chemotherapy is estimated to be the fastest-growing segment over the forecast period.
Home Infusion Therapy Market Overview
The home infusion therapy market is characterized by the provision of medical treatments administered at patients' homes rather than in traditional healthcare settings. This approach offers convenience, comfort, and cost-effectiveness, making it increasingly popular among patients with chronic illnesses. Home infusion therapy encompasses a range of treatments, including intravenous medications, antibiotics, hydration therapy, and parenteral nutrition, among others. Technological advancements in infusion devices and healthcare delivery systems have facilitated the growth of this market, making it easier for patients to receive complex treatments safely at home. Additionally, the rising prevalence of chronic diseases, aging population, and the desire for personalized healthcare experiences contribute to the expansion of the home infusion therapy market. Overall, this market trend reflects a shift towards patient-centered care and the growing importance of home-based healthcare solutions.
Home Infusion Therapy Market Report Scope
| Report Attribute |
Details |
| Market Size in 2024 |
USD 49.34 Billion |
| Market Size by 2033 |
USD 100.29 Billion |
| Growth Rate From 2024 to 2033 |
CAGR of 8.2% |
| Base Year |
2023 |
| Forecast Period |
2024 to 2033 |
| Segments Covered |
Product, application, region |
| Market Analysis (Terms Used) |
Value (US$ Million/Billion) or (Volume/Units) |
| Report Coverage |
Revenue forecast, company ranking, competitive landscape, growth factors, and trends |
| Key Companies Profiled |
CVS/Coram; Option Care Health; BriovaRx/Diplomat (UnitedHealth Optum); PharMerica; Fresenius Kabi; ICU Medical, Inc.; B. Braun Melsungen AG; Baxter; BD; Caesarea Medical Electronics; Smiths Medical; Terumo Corporation; JMS Co. Ltd. |
Home Infusion Therapy Market Growth
Home infusion therapy involves delivering therapeutic treatments, medications, or fluids directly into a patient's bloodstream through intravenous (IV) infusion, usually in the comfort and convenience of their home.
The growth of the market is driven by several key factors, including the expanding geriatric population characterized by decreased mobility, a rising preference for home care, and the swift evolution of technological advancements. Infusion therapy, encompassing essential components like IV therapy and IV hydration therapy, plays a crucial role in addressing conditions such as immune deficiencies, cancer, and congestive heart failure, where oral medication is not a viable treatment option. The increasing demand for these therapies stems from the need for long-term treatment among patients, positioning home infusion therapy as a notably cost-effective alternative to hospital-based care. The incorporation of IV therapy and IV hydration therapy serves as a driving force, providing patients with enhanced accessibility to effective and personalized medical solutions in the comfort of their homes.
The home infusion market experienced a positive shift during the COVID-19 pandemic, with home infusion becoming a crucial necessity as healthcare facilities faced a surge in COVID patients. Despite the challenges posed by regional and country-wide lockdowns, causing disruptions in operations and supply chains, the market witnessed a substantial increase in 2020. As reported by Medtech Dive in October 2020, Baxter disclosed third-quarter sales of USD 2.97 billion, marking a 4% growth attributed to the rising demand for its COVID-related medical products. Furthermore, Baxter reported operational sales growth of 6% (reaching 3.2 billion) in Q3 2021 compared to 3.0 billion in Q3 2020, indicating a sustained recovery from the pandemic's impact.
Moreover, the market's expansion is propelled by the enhanced outcomes observed in patients and the cost-effectiveness and convenience provided by home infusion therapy. The increasing demographic of baby boomers struggling with diminished mobility due to conditions such as paralysis, osteoarthritis, and diabetes is expected to amplify the demand for home infusion therapy. The growing imperative to reduce the duration of inpatient stays is a pivotal factor poised to contribute significantly to the market's growth. Remarkably, continuous subcutaneous (SC) apomorphine infusion emerges as an exceptionally effective treatment for Parkinson's disease (PD), with diverse drug formulations available for the management of PD through subcutaneous delivery. In response to the mounting burden of PD, there is a notable surge in the demand for subcutaneous infusion therapy. For instance, in line with the Parkinson's Foundation's 2022 data update, approximately 90,000 individuals receive a PD diagnosis annually in the U.S. Furthermore, the anticipated number of people living with PD in the country is projected to soar to nearly 3.2 million by the year 2033.
Home Infusion Therapy Market By Product Insights
The infusion pumps segment accounted for the largest revenue share of over 51.13% in 2023. Infusion pumps, designed for controlled delivery of fluids, medications, and nutrients, were initially exclusive to healthcare facilities but are now widely adopted in outpatient settings. These devices ensure precision, reducing medication errors. The surge in home healthcare has driven the demand for syringe and ambulatory pumps. Smart pumps, featuring barcode technology, enhance patient identity verification, preventing administration errors. These pumps also provide alerts to healthcare workers in case of inappropriate dosage selection. The introduction of advanced infusion pumps, like the CADD-Solis ambulatory infusion pump by Smiths Medical, is expected to propel market growth in the forecast period.
Needleless connectors are anticipated to register the highest CAGR over the forecast period. Needless connectors are small devices employed in intravenous systems to reduce needlestick injuries, thereby preventing bacterial contamination and improving safety. These devices are evaluated on the basis of interstitial surface mechanisms, blood refluxes, visibility, and external surface mechanisms. Needless connectors enable smooth operative procedures, ensure safety, and aid in adhering to clinical practices.
Home Infusion Therapy Market By Application Insights
The anti-infective segment dominated the market for home infusion therapy in 2023 with a revenue share of over 26.19%. This is attributed to the considerable number of procedures performed for the administration of antifungal and antibiotic drugs. It also helps reduce exposure to patients with other hospital-acquired infections (HAIs).
Chemotherapy is estimated to be the fastest-growing segment over the forecast period. With the growing incidences of cancer, the demand for pressure pumps is expected to increase in the coming years. Pumps used for chemotherapy at home are compact, continuous pressure pumps that do not require a battery and can hence be used for a longer period of time. With the help of these pumps, chemotherapy drugs can be administered at the appropriate infusion speed and in the right amounts.
Home Infusion Therapy Market By Regional Insights
North America dominated the market in 2023 with a revenue share of over 56.32% and this trend is expected to continue throughout the forecast period. This can be attributed to the increasing R&D in the region and the rising adoption of new technology in infusion pumps. The increasing need for long-term therapy for patients with certain conditions is driving the regional market. Development of alternate healthcare settings and home infusion services and shifting preference from acute care to home care settings due to the low cost and enhanced patient mobility would boost the growth of this market in the coming years.

The Asia Pacific market is expected to register the fastest CAGR over the forecast period. This is attributed to rising patient awareness regarding the benefits of home infusion therapy over in-hospital procedures and the growing prevalence of diabetes in the region. The growing geriatric population and the rise in chronic diseases in the region are expected to further fuel the market growth. According to the Times of India, around 75 million people over the age of 60 years suffer from some chronic disease in India, which might increase the adoption of home care services in the country.
Home Infusion Therapy Market Recent Developments
- In June 2023, Baxter International, an American healthcare company, introduced Progressa+ Next Gen ICU bed for addressing critical needs of patients at their homes. This technology makes it easier for nurses to take care of patients, while supporting therapy at home.
- In May 2023, Fresenius Kabi, a global healthcare company, initiated an agreement with Premier, Inc., an American healthcare company, that resulted in pricing and term benefits for the Ivenix Infusion System. This system is designed to advance the reliability and simplicity of infusion pumps.
- In May 2023, Option Care Health, a healthcare service provider, created an independent platform for home care services in collaboration with Amedisys Inc., a leading provider of home health services. This platform comprises pharmacists, dieticians, therapists, social workers, and others for providing high quality healthcare services at home.
- In April 2023, CareFusion, currently owned by Becton Dickinson, an American medical technology company, launched an advanced ultrasound technology to provide clinicians with optimal IV insertions. More than 90% hospitalized patients receive the IV therapy, thus contributing towards the market growth of home infusion therapy.
- In January 2022, ICU Medical, a California-based global operations company, finalized the acquisition of Smiths Medical from Smiths Group Plc for creating a leading infusion therapy company with a combined revenue of USD 2.5 billion.
- In November 2021, Terumo Corporation, a global medical device company, developed a smartphone device for controlling insulin pump. This device can be utilized as a home infusion therapy by patients for harmonizing the insulin therapy at home.
Home Infusion Therapy Market Key Companies & Share Insights
Some of the key players operating in the market include Baxter, BD, Smiths Medical, Terumo Corporation, ICU Medical, etc
- Baxter International Inc., commonly known as Baxter, is a global healthcare company that specializes in providing a wide range of medical products, therapies, and technologies. With a rich history dating back to the 1930s, Baxter has evolved into a leading player in the healthcare industry. The company develops innovative solutions for critical medical needs, including renal care, medication delivery, pharmaceuticals, and various therapeutic areas.
- Becton, Dickinson and Company (BD) is a global medical technology company. BD specializes in developing and manufacturing medical devices, laboratory equipment, and diagnostic products aimed at advancing the diagnosis and treatment of various medical conditions. With a commitment to improving healthcare outcomes, BD focuses on delivering solutions in areas such as medication management, infection prevention, diagnostics, and biosciences.
Home Infusion Therapy Market Top Key Companies:
- CVS/Coram
- Option Care Health
- BriovaRx/Diplomat (UnitedHealth Optum)
- PharMerica
- Fresenius Kabi
- ICU Medical, Inc.
- B. Braun Melsungen AG
- Baxter
- BD
- Caesarea Medical Electronics
- Smiths Medical
- Terumo Corporation
- JMS Co. Ltd.
Home Infusion Therapy Market Report Segmentation
This report forecasts revenue growth at country levels and provides an analysis of the latest industry trends in each of the sub-segments from 2021 to 2033. For this study, Nova one advisor, Inc. has segmented the Home Infusion Therapy market.
By Product
- Infusion Pumps
- Elastomeric
- Electromechanical
- Gravity
- Others
- Intravenous Sets
- IV Cannulas
- Needleless Connectors
By Application
- Anti-infective
- Endocrinology
- Hydration Therapy
- Chemotherapy
- Enteral Nutrition
- Parenteral Nutrition
- Specialty Pharmaceuticals
- Others
By Region
- North America
- Europe
- Asia-Pacific
- Latin America
- Middle East & Africa (MEA)


