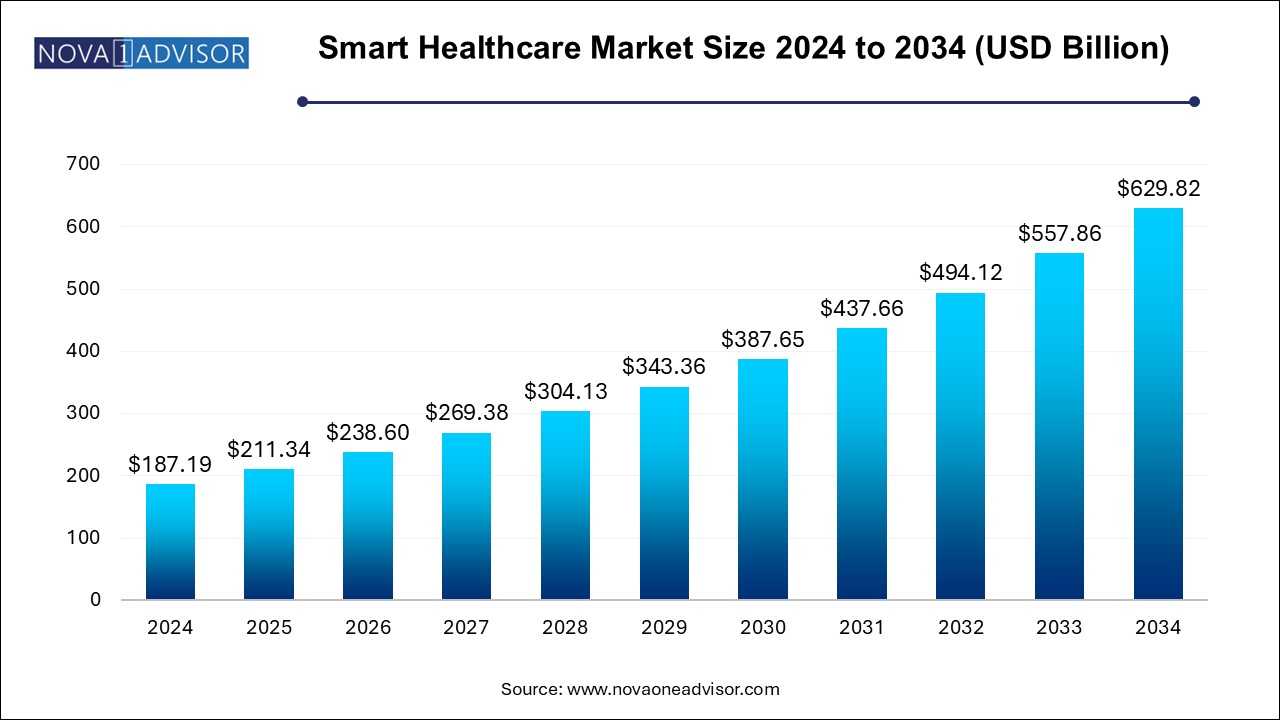
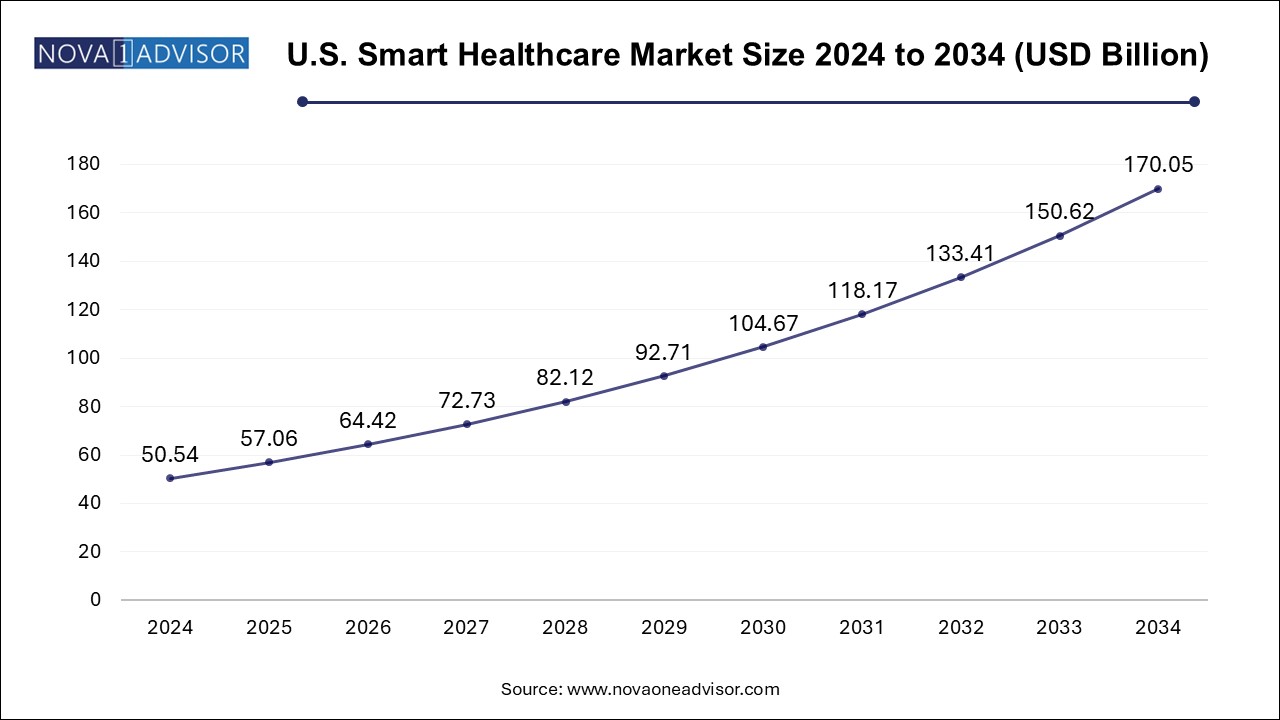
Smart Healthcare Market Size, Share & Trends Analysis Report By Product (RFID Kanban Systems, RFID Smart Cabinets, Electronic Health Records, Telemedicine, mHealth, Smart Pills, Smart Syringes), By Region, And Segment- Global Industry Analysis, Share, Growth, Regional Outlook and Forecasts, 2023-2032

The global smart healthcare market size was estimated at USD 145.6 billion in 2022 and is expected to surpass around USD 489.89 billion by 2032 and poised to grow at a compound annual growth rate (CAGR) of 12.9% during the forecast period 2023 to 2032.

Smart Healthcare Market Size, 2023 to 2032 (USD Billion )

Key Takeaways:

  • North America dominated the smart healthcare market and accounted for a revenue share of over 36.6% in 2022.
  • In the Asia Pacific, the market for smart healthcare is expected to exhibit lucrative growth over the forecast period.
  • Based on product, the mHealth segment dominated the market for smart healthcare and accounted for a revenue share of over 36.0% in 2022.
  • RFID kanban system is the fastest-growing segment from 2023 to 2032.
  • Telemedicine accounted for the second-fastest-growing segment in the market for smart healthcare.

Smart Healthcare Market Report Scop

Report Coverage Details
Market Size in 2023 USD 164.38 Billion
Market Size by 2032 USD 489.89 Billion
Growth Rate From 2023 to 2032 CAGR of 12.9%
Base Year 2022
Forecast Period 2023 to 2032
Segments Covered Product, End-use, Region
Market Analysis (Terms Used) Value (US$ Million/Billion) or (Volume/Units)
Regional Scope North America; Europe; Asia Pacific; Central and South America; the Middle East and Africa
Key Companies Profiled IBM; Cisco; GE Healthcare; Olympus Corporation; Brooks Automation; Given Imaging, Inc.; Stanley Innerspace; Solstice Medical LLC; Siemens Medical Solutions; Allscripts Healthcare Solutions; Samsung Electronics Corporation; AirStrip Technologies Inc.; Apple Inc.; AT&T Inc.; Logi-Tag; Cerner Corporation; Pepperl+Fuchs; Hurst Green Plastics Ltd.; Bollhoff Group; Wurth Group; McKesson Corporation; Brooks Automation;  LogTag


The rising adoption of mHealth, government initiatives to digitize healthcare, and the prevalence of chronic disorders are likely to accentuate the demand for smart healthcare systems. Digitalization has transformed the healthcare industry. The adoption of mHealth has increased substantially in the past few years, majorly owing to the rising usage of smartphones and digitization. As per a United Healthcare Consumer Sentiment Survey, in 2019, approximately 37.0% of Americans rely on the internet or mobile apps for consultations related to their health conditions.

With the COVID-19 advent, smart healthcare products noticed a sudden increased demand. Smart healthcare adoption has increased during the pandemic situation, and this adoption rate is further projected to grow in the post-COVID-19 scenario. Consequently, many businesses are expanding their products and services; for instance, in November 2020, Vera Smart Health invested around USD 20 billion to increase its services into home-based tests and diagnostics, remote health services, medication delivery, virtual care, and nutrition consultation services. Therefore, substantial demand for smart healthcare products is anticipated due to the COVID-19 emergency.

Rising participation from the industry players is expected to further drive the market for smart healthcare. For instance, in April 2020, Phillips introduced a new application for the care manager acuity-based scoring tools to scrutinize patient conditions to detect deterioration or any adverse trends related to COVID-19. Similarly, in October 2019, Teladoc Health launched Teladoc medical professionals for patients suffering from complicated mental and physical health conditions. This is intended to integrate expert medical services and physicians with their patients effortlessly. Such advancements are expected to drive the market for smart healthcare during the forecast period. 

Supportive government programs are projected to bode well for the growth of the market for smart healthcare. For instance, in March 2020, the Quebec government in collaboration with the Canadian Medical Association (CMA) had decided to expand the access to telehealth services across different provinces of Canada such as Alberta, New Brunswick, British Columbia, Manitoba, Ontario, Newfoundland and, and others. Such attempts are expected to put the forefront of digital patient-oriented healthcare services globally. 

Moreover, in March 2020, the NHS U.K. encouraged first-tier medical institutions to use telemedicine to reduce the COVID-19 spread. As of now, at primary care clinics, the U.K. records nearly 342 million files of annual medical consultations and only 1% of them are made through video calls. However, the NHS is planning to implement telemedicine services by reducing face-to-face consultation.

Product Insights

Based on product, the mHealth segment dominated the market for smart healthcare and accounted for a revenue share of over 36.0% in 2022. The dominance is attributed to high internet usage, smartphones, and the adoption of mHealth apps. Moreover, the introduction of wearable devices from Apple, Fitbit, and MI is influencing the market positively. In April 2020, Proxxi, a Canadian firm launched a wearable device, Halo. This device is designed to ensure compliance with social distancing at a workplace during the ongoing global COVID-19 pandemic. This device would constantly notify of separation to ensure proper social distancing. 

RFID kanban system is the fastest-growing segment from 2023 to 2032. The key trends aiding in the adoption of RFID are supply chain management, automation, real-time intelligence, and asset tracking. RFID technology help to identify issues in the workflow of hospitals especially to move patients in and out quickly and more efficiently. Moreover, RFID in Real-Time Location Systems (RTLS) also helps to track newborn babies. Thus, owing to the aforementioned reasons the segment is likely to grow during the forecast period. 

Telemedicine accounted for the second-fastest-growing segment in the market for smart healthcare. In the wake of the ongoing COVID-19 outbreak, it is anticipated to boost the adoption and usage of telemedicine by healthcare professionals to connect effectively with their patients. Owing to social distancing globally, virtual care delivery is stepping up as an effective solution for secure and superior communication. Furthermore, companies are collaborating with hospitals to monitor COVID-19 patients. For instance, in March 2020, the All India Institute of Medical Sciences (AIIMS) launched a 24/7 Telemedicine Hub, CoNTeC. It is a real-time telemedicine hub aimed to assist physicians to treat patients.

Regional Insights

North America dominated the smart healthcare market and accounted for a revenue share of over 36.6% in 2022. This is attributed to supportive government policies for the deployment of digital health and the accessibility of infrastructure with high digital literacy. Furthermore, the presence of key market participants, growing awareness about connected healthcare, high penetration of the internet, and smartphones, along with the usage of health-related apps are a few of the key factors responsible for the growth of the market for smart healthcare. 

In March 2020, the American Hospital Association (AMA) stated that nearly 76% of hospitals in the U.S. use telehealth to connect with consulting practitioners and patients owing to its affordability and elevated health care value. Moreover, the successful implementation of e-prescription systems and Electronic Health Records (EHR) in various healthcare centers drive regional market growth.

In the Asia Pacific, the market for smart healthcare is expected to exhibit lucrative growth over the forecast period. Countries such as Japan, Australia, and India exhibit significant potential owing to their developed healthcare IT infrastructure and growing investments in smart healthcare. A rise in the number of government digitalization programs in emerging nations such as China and India is expected to drive the adoption of digital healthcare solutions such as health services. With growing COVID-19 cases in the region, companies are increasingly investing in telemedicine services. On April 14, 2020, Huawei commended the provision of wireless networks, conferencing, and smartphones across Thailand, Bangladesh, and Malaysia. This is intended to increase the adoption of telemedicine practices to combat the COVID-19 pandemic in the region.

Key Companies & Market Share Insights 

Players undertook various strategic initiatives such as mergers and acquisitions, product launches and partnerships, and collaborations to gain more penetration. For instance, in September 2021, MSF introduced free telemedicine helpline for COVID-19 patients in India. In April 2020, IBM released AI-powered technologies to assist the research and health community in hastening the discovery of medical insights and treatments for COVID-19 by launching the COVID-19 High-Performance Computing Consortium in the collaboration with the U.S. Department of Energy and the White House Office of Science and Technology. Also, in March 2020, Siemens Healthineers launched Teamplay digital health platform. It is aimed to enable healthcare to offer digital transformation and eases quick access to clinical and operational solutions. Some of the prominent players in the smart healthcare market include:

  • AirStrip Technologies Inc.
  • Allscripts Healthcare Solutions
  • Apple Inc.
  • AT&T Inc.
  • Brooks Automation
  • Cerner Corporation
  • Cisco
  • GE Healthcare
  • Given Imaging, Inc.
  • Hurst Green Plastics Ltd.
  • IBM
  • Logi-Tag
  • McKesson Corporation
  • Olympus Corporation
  • Pepperl+Fuchs
  • Samsung Electronics Corporation
  • Siemens Medical Solutions
  • Solstice Medical LLC
  • Stanley Innerspac
  • Bollhoff Group
  • Wurth Group

Segments Covered in the Report

This report forecasts revenue growth at global, regional, and country levels and provides an analysis of the latest industry trends in each of the sub-segments from 2018 to 2032. For this study, Nova one advisor, Inc. has segmented the global Smart Healthcare market.

By Product 

  • RFID Kanban Systems
  • RFID Smart Cabinets
  • Electronic Health Records (EHR)
    • Web-based EHR
    • Client-server Based EHR
  • Telemedicine
    • Hardware
    • Software
    • Others
  • mHealth
    • Monitoring Services
    • Diagnosis Services
    • Healthcare Systems Strengthening
    • Others
  • Smart Pills
  • Smart Syringes

End-use 

  • Hospitals
  • Homecare Settings
  • Others

By Region

  • North America
  • Europe
  • Asia-Pacific
  • Latin America
  • Middle East & Africa (MEA)

Frequently Asked Questions

The global smart healthcare market size was estimated at USD 145.6 billion in 2022 and is expected to surpass around USD 489.89 billion by 2032

The global smart healthcare market is expected to grow at a compound annual growth rate of 12.9% from 2023 to 2032

Some key players operating in the smart healthcare market include IBM, Cisco., GE Healthcare, Olympus Corporation, Brooks Automation, Given Imaging, Inc., Stanley Innerspace, Solstice Medical LLC, Siemens Medical Solutions, Allscripts Healthcare Solutions, Samsung Electronics Corporation, AirStrip Technologies Inc., Apple Inc., AT&T Inc., Logi-Tag, Cerner Corporation, Pepperl+Fuchs, Hurst Green Plastics Ltd., Stanley Innerspace, Bollhoff Group, Wurth Group, McKesson Corporation, Brooks Automation, and LogTag.

Key factors that are driving the smart healthcare market growth include the rising adoption of mHealth, government initiatives to digitize healthcare, and the prevalence of chronic disorders are likely to accentuate the demand for smart healthcare systems.

Chapter 1. Methodology and Scope
                    1.1. Market Segmentation and Scope
                    1.2. Research Methodology
                        1.2.1. Information Procurement
                    1.3. Information or Data Analysis
                    1.4. Methodology
                    1.5. Research Scope and Assumptions
                    1.6. Market Formulation & Validation
                        1.6.1. COUNTRY MARKET: CAGR CALCULATION
                    1.7. Country Based Segment Share Calculation
                    1.8. List of Data Sources
Chapter 2. Executive Summary
                    2.1. Market Outlook
                    2.2. Segment Outlook
                    2.3. Regional Insights
                    2.4. Competitive Insights
                    2.5. Smart Healthcare Market Snapshot
                    2.6. Smart Healthcare Market Segment Snapshot
                    2.7. Smart Healthcare Market Competitive Landscape Snapshot
Chapter 3. Smart Healthcare Market Variables, Trends, & Scope
                    3.1. Market Lineage Outlook
                    3.2. Market Dynamics
                        3.2.1. Market Driver Analysis
                        3.2.2. Market Restraint Analysis
                        3.2.3. Key Opportunity Prioritized
                    3.3. Smart Healthcare Market Analysis Tools
                        3.3.1. Industry Analysis – Porter’s
                            3.3.1.1. Bargaining power of the suppliers
                            3.3.1.2. Bargaining power of the buyers
                            3.3.1.3. Threats of substitution
                            3.3.1.4. Threats from new entrants
                            3.3.1.5. Competitive rivalry
                        3.3.2. PESTEL Analysis
                            3.3.2.1. Political landscape
                            3.3.2.2. Economic and Social landscape
                            3.3.2.3. Technological landscape
                    3.4. Impact of COVID-19 on Smart Healthcare Market
Chapter 4. Smart Healthcare Market: Product Type Estimates & Trend Analysis
                    4.1. Segment Dashboard
                    4.2. Smart Healthcare Market: Product Type Movement Analysis, USD Million, 2023 – 2032
                    4.3. RFID Kanban Systems
                        4.3.1. RFID Kanban Systems Market Revenue Estimates and Forecasts, 2020 – 2032
                    4.4. RFID Smart Cabinets
                        4.4.1. RFID Smart Cabinets Market Revenue Estimates and Forecasts, 2020 – 2032
                    4.5. Electronic Health Records (EHR)
                        4.5.1. Electronic Health Records (EHR) Market Revenue Estimates and Forecasts, 2020 – 2032
                        4.5.2. Web-based HER
                            4.5.2.1. Web-based HER Market Revenue Estimates and Forecasts, 2020 – 2032
                        4.5.3. Client-server Based HER
                            4.5.3.1. Client-server Based HER Market Revenue Estimates and Forecasts, 2020 – 2032
                    4.6. Telemedicine
                        4.6.1. Telemedicine Market Revenue Estimates and Forecasts, 2020 – 2032
                        4.6.2. Hardware
                            4.6.2.1. Hardware Market Revenue Estimates and Forecasts, 2020 – 2032
                        4.6.3. Software
                            4.6.3.1. Software Market Revenue Estimates and Forecasts, 2020 – 2032
                        4.6.4. Others
                            4.6.4.1. Others Market Revenue Estimates and Forecasts, 2020 – 2032
                    4.7. mHealth
                        4.7.1. mHealth Market Revenue Estimates and Forecasts, 2020 – 2032
                        4.7.2. Monitoring Services
                            4.7.2.1. Monitoring Services Market Revenue Estimates and Forecasts, 2020 – 2032
                        4.7.3. Diagnosis Services
                            4.7.3.1. Diagnosis Services Market Revenue Estimates and Forecasts, 2020 – 2032
                        4.7.4. Healthcare Systems Strengthening
                            4.7.4.1. Healthcare Systems Strengthening Market Revenue Estimates and Forecasts, 2020 – 2032
                        4.7.5. Others
                            4.7.5.1. Others Market Revenue Estimates and Forecasts, 2020 – 2032
                    4.8. Smart Pills
                        4.8.1. Smart Pills Revenue Estimates and Forecasts, 2020 – 2032
                    4.9. Smart Syringes
                        4.9.1. Smart Syringes Market Revenue Estimates and Forecasts, 2020 – 2032
Chapter 5. Smart Healthcare Market: End Use Estimates & Trend Analysis
                    5.1. Segment Dashboard
                    5.2. Smart Healthcare Market: End Use Movement Analysis, USD Million, 2023 – 2032
                    5.3. Hospitals
                        5.3.1. Hospitals Market Revenue Estimates and Forecasts, 2020 – 2032
                    5.4. Homecare Settings
                        5.4.1. Homecare Settings Market Revenue Estimates and Forecasts, 2020 – 2032
                    5.5. Others
                        5.5.1. Others Market Revenue Estimates and Forecasts, 2020 – 2032
Chapter 6. Smart Healthcare Market: Regional Estimates & Trend Analysis
                    6.1. Smart Healthcare Market: Regional Movement Analysis, 2023 – 2032
                    6.2. North America
                        6.2.1. North America Smart Healthcare Market Estimates And Forecasts, 2020 – 2032
                        6.2.2. U.S.
                            6.2.2.1. Key Country Dynamics
                            6.2.2.2. Competitive Scenario
                            6.2.2.3. Prevalence Insights
                            6.2.2.4. Regulatory Framework
                            6.2.2.5. U.S. Smart Healthcare Market Estimates And Forecasts, 2020 – 2032
                        6.2.3. Canada
                            6.2.3.1. Key Country Dynamics
                            6.2.3.2. Competitive Scenario
                            6.2.3.3. Prevalence Insights
                            6.2.3.4. Regulatory Framework
                            6.2.3.5. Canada Smart Healthcare Market Estimates And Forecasts, 2020 – 2032
                    6.3. Europe
                        6.3.1. Europe Smart Healthcare Market Estimates And Forecasts, 2020 – 2032
                        6.3.2. UK
                            6.3.2.1. Key Country Dynamics
                            6.3.2.2. Competitive Scenario
                            6.3.2.3. Prevalence Insights
                            6.3.2.4. Regulatory Framework
                            6.3.2.5. UK Smart Healthcare Market Estimates And Forecasts, 2020 – 2032
                        6.3.3. Germany
                            6.3.3.1. Key Country Dynamics
                            6.3.3.2. Competitive Scenario
                            6.3.3.3. Prevalence Insights
                            6.3.3.4. Regulatory Framework
                            6.3.3.5. Germany Smart Healthcare Market Estimates And Forecasts, 2020 – 2032
                        6.3.4. France
                            6.3.4.1. Key Country Dynamics
                            6.3.4.2. Competitive Scenario
                            6.3.4.3. Prevalence Insights
                            6.3.4.4. Regulatory Framework
                            6.3.4.5. France Smart Healthcare Market Estimates And Forecasts, 2020 – 2032
                        6.3.5. Italy
                            6.3.5.1. Key Country Dynamics
                            6.3.5.2. Competitive Scenario
                            6.3.5.3. Prevalence Insights
                            6.3.5.4. Regulatory Framework
                            6.3.5.5. Italy Smart Healthcare Market Estimates And Forecasts, 2020 – 2032
                        6.3.6. Spain
                            6.3.6.1. Key Country Dynamics
                            6.3.6.2. Competitive Scenario
                            6.3.6.3. Prevalence Insights
                            6.3.6.4. Regulatory Framework
                            6.3.6.5. Spain Smart Healthcare Market Estimates And Forecasts, 2020 – 2032
                        6.3.7. Denmark
                            6.3.7.1. Key Country Dynamics
                            6.3.7.2. Competitive Scenario
                            6.3.7.3. Prevalence Insights
                            6.3.7.4. Regulatory Framework
                            6.3.7.5. Denmark Smart Healthcare Market Estimates And Forecasts, 2020 – 2032
                        6.3.8. Sweden
                            6.3.8.1. Key Country Dynamics
                            6.3.8.2. Competitive Scenario
                            6.3.8.3. Prevalence Insights
                            6.3.8.4. Regulatory Framework
                            6.3.8.5. Sweden Smart Healthcare Market Estimates And Forecasts, 2020 – 2032
                        6.3.9. Norway
                            6.3.9.1. Key Country Dynamics
                            6.3.9.2. Competitive Scenario
                            6.3.9.3. Prevalence Insights
                            6.3.9.4. Regulatory Framework
                            6.3.9.5. Norway Smart Healthcare Market Estimates And Forecasts, 2020 – 2032
                    6.4. Asia Pacific
                        6.4.1. Asia Pacific Smart Healthcare Market Estimates And Forecasts, 2020 – 2032
                        6.4.2. Japan
                            6.4.2.1. Key Country Dynamics
                            6.4.2.2. Competitive Scenario
                            6.4.2.3. Prevalence Insights
                            6.4.2.4. Regulatory Framework
                            6.4.2.5. Japan Smart Healthcare Market Estimates And Forecasts, 2020 – 2032
                        6.4.3. China
                            6.4.3.1. Key Country Dynamics
                            6.4.3.2. Competitive Scenario
                            6.4.3.3. Prevalence Insights
                            6.4.3.4. Regulatory Framework
                            6.4.3.5. China Smart Healthcare Market Estimates And Forecasts, 2020 – 2032
                        6.4.4. India
                            6.4.4.1. Key Country Dynamics
                            6.4.4.2. Competitive Scenario
                            6.4.4.3. Prevalence Insights
                            6.4.4.4. Regulatory Framework
                            6.4.4.5. India Smart Healthcare Market Estimates And Forecasts, 2020 – 2032
                        6.4.5. South Korea
                            6.4.5.1. Key Country Dynamics
                            6.4.5.2. Competitive Scenario
                            6.4.5.3. Prevalence Insights
                            6.4.5.4. Regulatory Framework
                            6.4.5.5. South Korea Smart Healthcare Market Estimates And Forecasts, 2020 – 2032
                        6.4.6. Australia
                            6.4.6.1. Key Country Dynamics
                            6.4.6.2. Competitive Scenario
                            6.4.6.3. Prevalence Insights
                            6.4.6.4. Regulatory Framework
                            6.4.6.5. Australia Smart Healthcare Market Estimates And Forecasts, 2020 – 2032
                        6.4.7. Thailand
                            6.4.7.1. Key Country Dynamics
                            6.4.7.2. Competitive Scenario
                            6.4.7.3. Prevalence Insights
                            6.4.7.4. Regulatory Framework
                            6.4.7.5. Thailand Smart Healthcare Market Estimates And Forecasts, 2020 – 2032
                    6.5. Latin America
                        6.5.1. Latin America Smart Healthcare Market Estimates And Forecasts, 2020 – 2032
                        6.5.2. Brazil
                            6.5.2.1. Key Country Dynamics
                            6.5.2.2. Competitive Scenario
                            6.5.2.3. Prevalence Insights
                            6.5.2.4. Regulatory Framework
                            6.5.2.5. Brazil Smart Healthcare Market Estimates And Forecasts, 2020 – 2032
                        6.5.3. Mexico
                            6.5.3.1. Key Country Dynamics
                            6.5.3.2. Competitive Scenario
                            6.5.3.3. Prevalence Insights
                            6.5.3.4. Regulatory Framework
                            6.5.3.5. Mexico Smart Healthcare Market Estimates And Forecasts, 2020 – 2032
                        6.5.4. Argentina
                            6.5.4.1. Key Country Dynamics
                            6.5.4.2. Competitive Scenario
                            6.5.4.3. Prevalence Insights
                            6.5.4.4. Regulatory Framework
                            6.5.4.5. Argentina Smart Healthcare Market Estimates And Forecasts, 2020 – 2032
                    6.6. Middle East & Africa
                        6.6.1. Middle East & Africa Smart Healthcare Market Estimates And Forecasts, 2020 – 2032
                        6.6.2. South Africa
                            6.6.2.1. Key Country Dynamics
                            6.6.2.2. Competitive Scenario
                            6.6.2.3. Prevalence Insights
                            6.6.2.4. Regulatory Framework
                            6.6.2.5. South Africa Smart Healthcare Market Estimates And Forecasts, 2020 – 2032
                        6.6.3. Saudi Arabia
                            6.6.3.1. Key Country Dynamics
                            6.6.3.2. Competitive Scenario
                            6.6.3.3. Prevalence Insights
                            6.6.3.4. Regulatory Framework
                            6.6.3.5. Saudi Arabia Smart Healthcare Market Estimates And Forecasts, 2020 – 2032
                        6.6.4. UAE
                            6.6.4.1. Key Country Dynamics
                            6.6.4.2. Competitive Scenario
                            6.6.4.3. Prevalence Insights
                            6.6.4.4. Regulatory Framework
                            6.6.4.5. UAE Smart Healthcare Market Estimates And Forecasts, 2020 – 2032
                        6.6.5. Kuwait
                            6.6.5.1. Key Country Dynamics
                            6.6.5.2. Competitive Scenario
                            6.6.5.3. Prevalence Insights
                            6.6.5.4. Regulatory Framework
                            6.6.5.5. Kuwait Smart Healthcare Market Estimates And Forecasts, 2020 – 2032
Chapter 7. Competitive Landscape
                    7.1. Company Categorization
                    7.2. Company Market Share Analysis, 2022
                    7.3. Strategy Mapping
                    7.4. Company Profiles/Listing
                        7.4.1. CISCO
                            7.4.1.1. Overview
                            7.4.1.2. Financial Performance (Net Revenue)
                            7.4.1.3. Product Benchmarking
                            7.4.1.4. Strategic Initiatives
                        7.4.2. IBM
                            7.4.2.1. Overview
                            7.4.2.2. Financial Performance (Net Revenue)
                            7.4.2.3. Product Benchmarking
                            7.4.2.4. Strategic Initiatives
                        7.4.3. Given Imaging, Inc.
                            7.4.3.1. Overview
                            7.4.3.2. Financial Performance (Net Revenue)
                            7.4.3.3. Product Benchmarking
                            7.4.3.4. Strategic Initiatives
                        7.4.4. Olympus Corporation
                            7.4.4.1. Overview
                            7.4.4.2. Financial Performance (Net Revenue)
                            7.4.4.3. Product Benchmarking
                            7.4.4.4. Strategic Initiatives
                        7.4.5. Logi-Tag
                            7.4.5.1. Overview
                            7.4.5.2. Financial Performance (Net Revenue)
                            7.4.5.3. Product Benchmarking
                            7.4.5.4. Strategic Initiatives
                        7.4.6. Brooks Automation
                            7.4.6.1. Overview
                            7.4.6.2. Financial Performance (Net Revenue)
                            7.4.6.3. Product Benchmarking
                            7.4.6.4. Strategic Initiatives
                        7.4.7. Stanley Innerspace
                            7.4.7.1. Overview
                            7.4.7.2. Financial Performance (Net Revenue)
                            7.4.7.3. Product Benchmarking
                            7.4.7.4. Strategic Initiatives
                        7.4.8. Solstice Medical LLC
                            7.4.8.1. Overview
                            7.4.8.2. Financial Performance (Net Revenue)
                            7.4.8.3. Product Benchmarking
                            7.4.8.4. Strategic Initiatives
                        7.4.9. GE Healthcare
                            7.4.9.1. Overview
                            7.4.9.2. Financial Performance (Net Revenue)
                            7.4.9.3. Product Benchmarking
                            7.4.9.4. Strategic Initiatives
                        7.4.10. Siemens Medical Solutions
                            7.4.10.1. Overview
                            7.4.10.2. Financial Performance (Net Revenue)
                            7.4.10.3. Product Benchmarking
                            7.4.10.4. Strategic Initiatives
                        7.4.11. McKesson Corp.
                            7.4.11.1. Overview
                            7.4.11.2. Financial Performance (Net Revenue)
                            7.4.11.3. Product Benchmarking
                            7.4.11.4. Strategic Initiatives
                        7.4.12. Allscripts Healthcare Solutions
                            7.4.12.1. Overview
                            7.4.12.2. Financial Performance (Net Revenue)
                            7.4.12.3. Product Benchmarking
                            7.4.12.4. Strategic Initiatives
                        7.4.13. Samsung Electronics Corporation
                            7.4.13.1. Overview
                            7.4.13.2. Financial Performance (Net Revenue)
                            7.4.13.3. Product Benchmarking
                            7.4.13.4. Strategic Initiatives
                        7.4.14. AirStrip Technologies Inc.
                            7.4.14.1. Overview
                            7.4.14.2. Financial Performance (Net Revenue)
                            7.4.14.3. Product Benchmarking
                            7.4.14.4. Strategic Initiatives
                        7.4.15. Apple Inc.
                            7.4.15.1. Overview
                            7.4.15.2. Financial Performance (Net Revenue)
                            7.4.15.3. Product Benchmarking
                            7.4.15.4. Strategic Initiatives
                        7.4.16. AT&T Inc.
                            7.4.16.1. Overview
                            7.4.16.2. Financial Performance (Net Revenue)
                            7.4.16.3. Product Benchmarking
                            7.4.16.4. Strategic Initiatives
                        7.4.17. Cerner Corporation
                            7.4.17.1. Overview
                            7.4.17.2. Financial Performance (Net Revenue)
                            7.4.17.3. Product Benchmarking
                            7.4.17.4. Strategic Initiatives
                        7.4.18. Pepperl+Fuchs
                            7.4.18.1. Overview
                            7.4.18.2. Financial Performance (Net Revenue)
                            7.4.18.3. Product Benchmarking
                            7.4.18.4. Strategic Initiatives
                        7.4.19. Hurst Green Plastics Ltd.
                            7.4.19.1. Overview
                            7.4.19.2. Financial Performance (Net Revenue)
                            7.4.19.3. Product Benchmarking
                            7.4.19.4. Strategic Initiatives
                        7.4.20. Bollhoff Group
                            7.4.20.1. Overview
                            7.4.20.2. Financial Performance (Net Revenue)
                            7.4.20.3. Product Benchmarking
                            7.4.20.4. Strategic Initiatives
                        7.4.21. Wurth Group
                            7.4.21.1. Overview
                            7.4.21.2. Financial Performance (Net Revenue)
                            7.4.21.3. Product Benchmarking
                            7.4.21.4. Strategic Initiatives

Proceed To Buy

USD 4500
USD 3800
USD 1900
USD 1200

Customization Offered

  • check-imgCross-segment Market Size and Analysis for Mentioned Segments
  • check-imgAdditional Company Profiles (Upto 5 With No Cost)
  • check-img Additional Countries (Apart From Mentioned Countries)
  • check-img Country/Region-specific Report
  • check-img Go To Market Strategy
  • check-imgRegion Specific Market Dynamics
  • check-imgRegion Level Market Share
  • check-img Import Export Analysis
  • check-imgProduction Analysis
  • check-imgOthers