U.S. Intrauterine Devices Market Size By Product (Copper IUD, Hormonal IUD), By Age Group (15-19, 20-24, 25-29, 30-34, 35-39, 40-44, 45+) - Industry Analysis, Share, Growth, Regional Outlook and Forecasts, 2023-2032

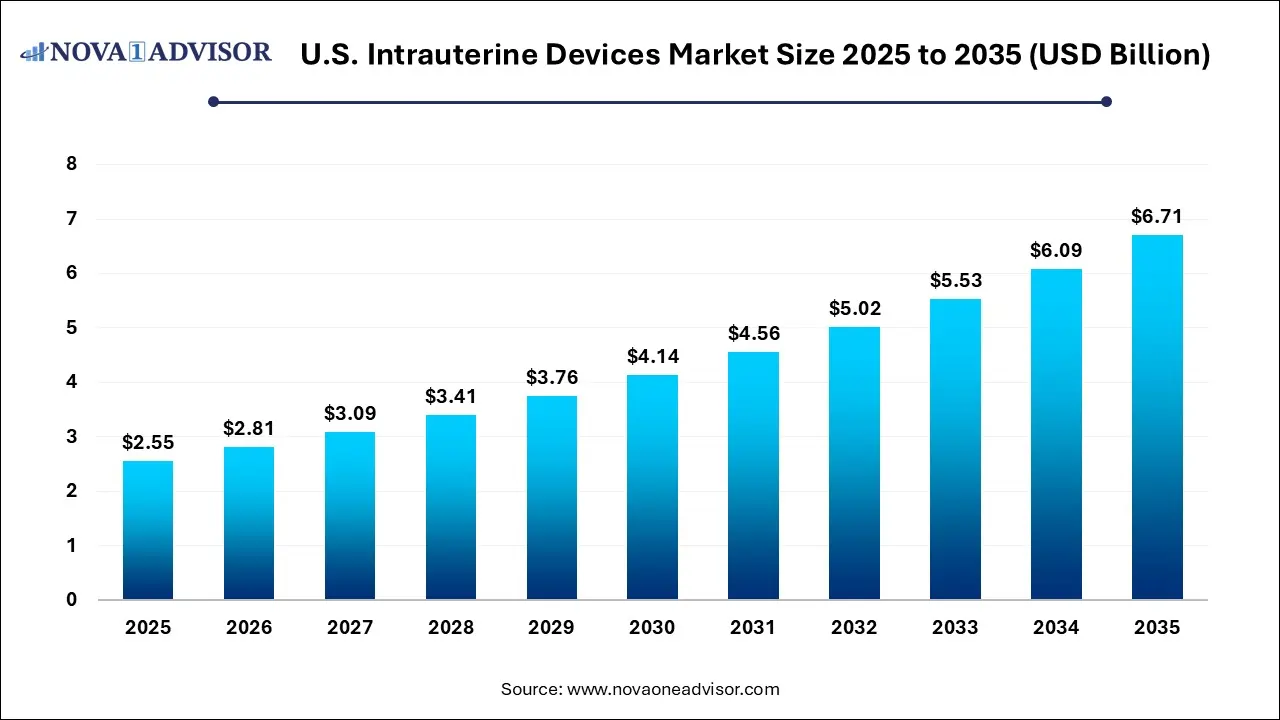
The U.S. intrauterine devices market size was exhibited at USD 1.31 billion in 2022 and is projected to hit around USD 3.44 billion by 2032, growing at a CAGR of 10.14% during the forecast period 2023 to 2032.

U.S. intrauterine devices market size

Key Pointers:

  • The hormonal IUD segment was valued at USD 1.1 Billion in 2022. 
  • The 25-29 age group segment was valued at around USD 319 million in 2022.

Report Scope of the U.S. Intrauterine Devices Market

Report Coverage

Details

Market Size in 2023

USD 1.44 Billion

Market Size by 2032

USD 3.44 Billion

Growth Rate from 2023 to 2032

CAGR of 10.14%

Base Year

2022

Forecast Period

2023 to 2032

Segments Covered

Product, Age Group

Key companies profiled

Bayer AG, CooperSurgical Inc. (CooperCompanies) and Allergan (AbbVie Inc.).


Major factors driving the market growth include the favorable regulatory scenario, technological advancements, and implementation of favorable initiatives by the U.S. government. The ongoing advancements, innovations, and the integration of advanced technologies for enhancing the patient experience are anticipated to propel the market revenue.

Intrauterine technology has been constantly evolving with an increased range of applications in birth control. The smaller frameless copper and levonorgestrel-releasing devices are increasing the preference for these devices among adolescent women. Market players are focusing to use new state-of-the-art technologies that enable them to develop strong and reliable devices. The rising contribution of such variables is set to prove beneficial for the U.S. market growth.

Intrauterine devices (IUD), also known as intrauterine contraceptive devices are employed for birth control that prevents pregnancy by stopping sperm from reaching and fertilizing eggs. It is a small and flexible contraceptive T-shaped device that can be inserted quickly & easily inside the uterus and physically prevent the implantation of fertilized ova. The 2 types of IUDs available are copper intrauterine devices and hormonal intrauterine devices.

However, adverse health issues comprising an infection of the uterus associated with the use of intrauterine devices may negatively impact the industry expansion. Bleeding and pain or discomfort are the key factors owing those women have an intrauterine device removed, accounting for over half of all removals before the usual replacement time. Few patients also experience other side effects after the IUD is placed such as cramps, irregular periods, spotting between periods, heavier periods with stronger cramping, etc. The pelvic inflammatory disease (PID) caused due to infection is one of the major disadvantages of intrauterine devices.

The recent outbreak of COVID-19 has negatively impacted the U.S. intrauterine devices market revenue. The revised standard operating protocols, and incorporation of social distancing norms have hindered the daily operations of several healthcare services, including common gynecologic procedures. The majority of the obstetrics and gynecological settings suspended or postponed the routine services and only catered to the emergency requirements. During the lockdown and travel restrictions, the published data indicate that the adoption of IUDs was impacted by the pandemic unfavorably in the gynecology hospitals & clinics. Further, as per the International Journal of Gynecology & Obstetrics, the supply chain disruptions had resulted in a stockout of several contraceptive methods comprising intrauterine devices across several zones in the country.

However, in 2021, as the number of COVID-19 affected patients reduced in several zones in the U.S., the gynecology hospitals & clinics resumed providing services including IUDs and steadily restoring the procedural volume to the pre-pandemic level. These factors are helping to uplift the market growth. Similarly, the technological developments, incorporation of telemedicine, and favorable initiatives have promoted the acceptance of intrauterine devices.  Thus, the COVID-19 pandemic has slightly affected the U.S. intrauterine devices market in the shorter run; however, the declining COVID-19 infection rates & patients and rising product adoption are set to facilitate the market expansion in the coming years.

Growing inclination towards planned delayed pregnancy in the U.S. is projected to promote the market growth. The adoption of novel strategies by the U.S. government to promote access to sexual & reproductive health services and products is expected to upsurge the inclination towards planned delayed pregnancy. The intrauterine devices are effective for 3 - 10 years and are around 99% efficient at preventing pregnancy. This variable has proven to be significant in increasing their adoption in planned delayed pregnancy. The rising adolescent female population across the country needs easy access to and use of contraceptives that include intrauterine devices to avoid problems such as unsafe abortions, unwanted pregnancy, etc. This is further contributing to the significant product adoption to prevent pregnancy. Furthermore, given the extensive implications of unintended pregnancies, the market opportunities for IUDs are anticipated to experience an upsurge in the coming years.

Based on product, the market is segmented as copper IUD and hormonal IUD. The hormonal IUD segment was valued at USD 1.1 Billion in 2022. This is attributable to the several advantages and health benefits offered by hormonal intrauterine devices. These IUDs are one of the most efficient birth control methods that have proven to be effective around 99% in avoiding pregnancy. It aids in long-term contraception, low pelvic infection risk, less menstrual flow, and painless menstrual cycles among others. These hormonal IUDs are recommended by healthcare professionals due to their several health benefits and better patient outcomes. Hormonal IUDs are considered to be highly safe owing to their non-contraceptive benefits and can be used by patients having heavy menstrual bleeding, endometriosis, anemia, fibroids, etc. Hormonal IUDs prevent pregnancies by thickening the mucus in the cervix as well as thins the lining of the uterus that partially suppresses ovulation. Therefore, the several advantages and health benefits offered by hormonal IUD are expected to propel the demand for hormonal IUDs and surge the market revenue in the forthcoming period.

Based on age group, the market is segmented as 15-19, 20-24, 25-29, 30-34, 35-39, 40-44, and 45+. The 25-29 age group segment was valued at around USD 319 million in 2022. This considerable market share is primarily owing to the rising awareness among 25-29 age group females regarding various IUD applications & consequences of unintended pregnancy, growing inclination towards planned delayed pregnancy, etc. Easy access to obstetricians and gynecologists that provide IUDs in their practice to the women population for the prevention of unwanted abortions and pregnancies is expected to drive product adoption among this age group.

As per the Guttmacher Institute studies, the percentage of unintended pregnancies is considerable in the age group of 25-29 years. The widespread IUD applications coupled with novel technological innovations contribute to effective contraception and fewer side effects, thereby augmenting product adoption in the prevention of unwanted abortions and pregnancies. As a result, the demand for IUDs witnessed a huge surge and is anticipated to follow the same trend in the coming years.

U.S. Intrauterine Devices Market Segmentation

By product By Age Group

Copper IUD

Hormonal IUD

15-19

20-24

25-29

30-34

35-39

40-44

45+


Frequently Asked Questions

The U.S. intrauterine devices market size was exhibited at USD 1.31 billion in 2022 and is projected to hit around USD 3.44 billion by 2032

The U.S. intrauterine devices market is growing at a compound annual growth rate (CAGR) of 10.14% from 2023 to 2032.

The regional hormonal intrauterine devices (IUD) market share had crossed USD 1.1 billion in 2022 and will expand with benefits like long-term contraception, less menstrual flow, low pelvic infection risk, and painless menstrual cycles.

The IUD market revenue in the U.S. from the 25-29 age group segment exceeded USD 319 million in 2022 and will rise with the increasing inclination towards planned delayed pregnancy.

Chapter 1. Introduction

1.1    Market definitions

1.2    Base estimates & working

1.3    Forecast calculations

1.4    Data validation

1.5    Data sources

1.5.1    Secondary

1.5.1.1   Paid sources

1.5.1.2   Unpaid sources

1.5.2    Primary

Chapter 2   Executive Summary

2.1    U.S. intrauterine devices industry 3600 synopsis, 2020 - 2032

2.1.1    Business trends

2.1.2    Product trends

2.1.3    Age group trends

2.1.4    Zonal Trends

Chapter 3   US Intrauterine Devices Industry Insights

3.1    Industry segmentation

3.2    Industry landscape, 2020 - 2032

3.3    Industry impact forces

3.3.1    Growth drivers

3.3.1.1   Favourable regulatory scenario

3.3.1.2   Rising awareness among U.S. women regarding various IUD applications

3.3.1.3   High number of unintended pregnancies

3.3.1.4   Government initiatives for the prevention of unwanted abortions and pregnancies

3.3.1.5   Growing inclination towards planned delayed pregnancy

3.3.2    Industry pitfalls & challenges

3.3.2.1   High cost of device

3.3.2.2   Risk of several health issues

3.3.2.3   Variability in insurance coverage and access

3.4    Growth potential analysis

3.4.1    By product

3.4.2    By age group

3.5    COVID-19 impact analysis

3.6    U.S. intrauterine device units sold, by brand, 2020 – 2032

3.7    Regulatory landscape

3.8    Porter’s analysis

3.9    Competitive landscape, 2022

3.9.1    Competitive matrix analysis, 2022

3.10    PESTEL analysis

Chapter 4   US Intrauterine Devices Market, By Product

4.1    Key segment trends

4.2    Copper IUD

4.2.1    Market size, by region, 2020 - 2032

4.3    Hormonal IUD

4.3.1    Market size, by region, 2020 - 2032

Chapter 5   US Intrauterine Devices Market, By Age Group

5.1    Key segment trends

5.2    15-19

5.2.1    Market size, by region, 2020 - 2032

5.3    20-24

5.3.1    Market size, by region, 2020 - 2032

5.4    25-29

5.4.1    Market size, by region, 2020 - 2032

5.5    30-34

5.5.1    Market size, by region, 2020 - 2032

5.6    35-39

5.6.1    Market size, by region, 2020 - 2032

5.7    40-44

5.7.1    Market size, by region, 2020 - 2032

5.8    45+

5.8.1    Market size, by region, 2020 - 2032

Chapter 6   US Intrauterine Devices Market, By Zones

6.1    Key zonal trends

6.2    East North Central

6.2.1    Market size, by states, 2020 - 2032

6.2.2    Market size, by product, 2020 - 2032

6.2.3    Market size, by age group, 2020 - 2032

6.2.4    Illinois

6.2.4.1   Market size, by product, 2020 - 2032

6.2.4.2   Market size, by age group, 2020 - 2032

6.2.5    Indiana

6.2.5.1   Market size, by product, 2020 - 2032

6.2.5.2   Market size, by age group, 2020 - 2032

6.2.6    Michigan

6.2.6.1   Market size, by product, 2020 - 2032

6.2.6.2   Market size, by age group, 2020 - 2032

6.2.7    Ohio

6.2.7.1   Market size, by product, 2020 - 2032

6.2.7.2   Market size, by age group, 2020 - 2032

6.2.8    Wisconsin

6.2.8.1   Market size, by product, 2020 - 2032

6.2.8.2   Market size, by age group, 2020 - 2032

6.3    West South Central

6.3.1    Market size, by states, 2020 - 2032

6.3.2    Market size, by product, 2020 - 2032

6.3.3    Market size, by age group, 2020 - 2032

6.3.4    Arkansas

6.3.4.1   Market size, by product, 2020 - 2032

6.3.4.2   Market size, by age group, 2020 - 2032

6.3.5    Louisiana

6.3.5.1   Market size, by product, 2020 - 2032

6.3.5.2   Market size, by age group, 2020 - 2032

6.3.6    Oklahoma

6.3.6.1   Market size, by product, 2020 - 2032

6.3.6.2   Market size, by age group, 2020 - 2032

6.3.7    Texas

6.3.7.1   Market size, by product, 2020 - 2032

6.3.7.2   Market size, by age group, 2020 - 2032

6.4    South Atlantic

6.4.1    Market size, by states, 2020 - 2032

6.4.2    Market size, by product, 2020 - 2032

6.4.3    Market size, by age group, 2020 - 2032

6.4.4    Delaware

6.4.4.1   Market size, by product, 2020 - 2032

6.4.4.2   Market size, by age group, 2020 - 2032

6.4.5    Florida

6.4.5.1   Market size, by product, 2020 - 2032

6.4.5.2   Market size, by age group, 2020 - 2032

6.4.6    Georgia

6.4.6.1   Market size, by product, 2020 - 2032

6.4.6.2   Market size, by age group, 2020 - 2032

6.4.7    Maryland

6.4.7.1   Market size, by product, 2020 - 2032

6.4.7.2   Market size, by age group, 2020 - 2032

6.4.8    North Carolina

6.4.8.1   Market size, by product, 2020 - 2032

6.4.8.2   Market size, by age group, 2020 - 2032

6.4.9    South Carolina

6.4.9.1   Market size, by product, 2020 - 2032

6.4.9.2   Market size, by age group, 2020 - 2032

6.4.10    Virginia

6.4.10.1    Market size, by product, 2020 - 2032

6.4.10.2    Market size, by age group, 2020 - 2032

6.4.11    West Virginia

6.4.11.1    Market size, by product, 2020 - 2032

6.4.11.2    Market size, by age group, 2020 - 2032

6.4.12    Washington D.C.

6.4.12.1    Market size, by product, 2020 - 2032

6.4.12.2    Market size, by age group, 2020 - 2032

6.5    North East

6.5.1    Market size, by states, 2020 - 2032

6.5.2    Market size, by product, 2020 - 2032

6.5.3    Market size, by age group, 2020 - 2032

6.5.4    Connecticut

6.5.4.1   Market size, by product, 2020 - 2032

6.5.4.2   Market size, by age group, 2020 - 2032

6.5.5    Maine

6.5.5.1   Market size, by product, 2020 - 2032

6.5.5.2   Market size, by age group, 2020 - 2032

6.5.6    Massachusetts

6.5.6.1   Market size, by product, 2020 - 2032

6.5.6.2   Market size, by age group, 2020 - 2032

6.5.7    New Hampshire

6.5.7.1   Market size, by product, 2020 - 2032

6.5.7.2   Market size, by age group, 2020 - 2032

6.5.8    Rhode Island

6.5.8.1   Market size, by product, 2020 - 2032

6.5.8.2   Market size, by age group, 2020 - 2032

6.5.9    Vermont

6.5.9.1   Market size, by product, 2020 - 2032

6.5.9.2   Market size, by age group, 2020 - 2032

6.5.10    New Jersey

6.5.10.1    Market size, by product, 2020 - 2032

6.5.10.2    Market size, by age group, 2020 - 2032

6.5.11    New York

6.5.11.1    Market size, by product, 2020 - 2032

6.5.11.2    Market size, by age group, 2020 - 2032

6.5.12    Pennsylvania

6.5.12.1    Market size, by product, 2020 - 2032

6.5.12.2    Market size, by age group, 2020 - 2032

6.6    East South Central

6.6.1    Market size, by states, 2020 - 2032

6.6.2    Market size, by product, 2020 - 2032

6.6.3    Market size, by age group, 2020 - 2032

6.6.4    Alabama

6.6.4.1   Market size, by product, 2020 - 2032

6.6.4.2   Market size, by age group, 2020 - 2032

6.6.5    Kentucky

6.6.5.1   Market size, by product, 2020 - 2032

6.6.5.2   Market size, by age group, 2020 - 2032

6.6.6    Mississippi

6.6.6.1   Market size, by product, 2020 - 2032

6.6.6.2   Market size, by age group, 2020 - 2032

6.6.7    Tennessee

6.6.7.1   Market size, by product, 2020 - 2032

6.6.7.2   Market size, by age group, 2020 - 2032

6.7    West North Central

6.7.1    Market size, by states, 2020 - 2032

6.7.2    Market size, by product, 2020 - 2032

6.7.3    Market size, by age group, 2020 - 2032

6.7.4    Iowa

6.7.4.1   Market size, by product, 2020 - 2032

6.7.4.2   Market size, by age group, 2020 - 2032

6.7.5    Kansas

6.7.5.1   Market size, by product, 2020 - 2032

6.7.5.2   Market size, by age group, 2020 - 2032

6.7.6    Mississippi

6.7.6.1   Market size, by product, 2020 - 2032

6.7.6.2   Market size, by age group, 2020 - 2032

6.7.7    Missouri

6.7.7.1   Market size, by product, 2020 - 2032

6.7.7.2   Market size, by age group, 2020 - 2032

6.7.8    Nebraska

6.7.8.1   Market size, by product, 2020 - 2032

6.7.8.2   Market size, by age group, 2020 - 2032

6.7.9    North Dakota

6.7.9.1   Market size, by product, 2020 - 2032

6.7.9.2   Market size, by age group, 2020 - 2032

6.7.10    South Dakota

6.7.10.1    Market size, by product, 2020 - 2032

6.7.10.2    Market size, by age group, 2020 - 2032

6.8    Pacific Central

6.8.1    Market size, by states, 2020 - 2032

6.8.2    Market size, by product, 2020 - 2032

6.8.3    Market size, by age group, 2020 - 2032

6.8.4    Alaska

6.8.4.1   Market size, by product, 2020 - 2032

6.8.4.2   Market size, by age group, 2020 - 2032

6.8.5    California

6.8.5.1   Market size, by product, 2020 - 2032

6.8.5.2   Market size, by age group, 2020 - 2032

6.8.6    Hawaii

6.8.6.1   Market size, by product, 2020 - 2032

6.8.6.2   Market size, by age group, 2020 - 2032

6.8.7    Oregon

6.8.7.1   Market size, by product, 2020 - 2032

6.8.7.2   Market size, by age group, 2020 - 2032

6.8.8    Washington

6.8.8.1   Market size, by product, 2020 - 2032

6.8.8.2   Market size, by age group, 2020 - 2032

6.9    Mountain States

6.9.1    Market size, by states, 2020 - 2032

6.9.2    Market size, by product, 2020 - 2032

6.9.3    Market size, by age group, 2020 - 2032

6.9.4    Arizona

6.9.4.1   Market size, by product, 2020 - 2032

6.9.4.2   Market size, by age group, 2020 - 2032

6.9.5    Colorado

6.9.5.1   Market size, by product, 2020 - 2032

6.9.5.2   Market size, by age group, 2020 - 2032

6.9.6    Utah

6.9.6.1   Market size, by product, 2020 - 2032

6.9.6.2   Market size, by age group, 2020 - 2032

6.9.7    Nevada

6.9.7.1   Market size, by product, 2020 - 2032

6.9.7.2   Market size, by age group, 2020 - 2032

6.9.8    New Mexico

6.9.8.1   Market size, by product, 2020 - 2032

6.9.8.2   Market size, by age group, 2020 - 2032

6.9.9    Idaho

6.9.9.1   Market size, by product, 2020 - 2032

6.9.9.2   Market size, by age group, 2020 - 2032

6.9.10    Montana

6.9.10.1    Market size, by product, 2020 - 2032

6.9.10.2    Market size, by age group, 2020 - 2032

6.9.11    Wyoming

6.9.11.1    Market size, by product, 2020 - 2032

6.9.11.2    Market size, by age group, 2020 - 2032

Chapter 7   Company Profiles

7.1    Competitive dashboard, 2021

7.2    Bayer AG

7.2.1    Business overview

7.2.2    Financial data

7.2.3    Product landscape

7.2.4    Strategic outlook

7.2.5    SWOT analysis

7.3    CooperSurgical Inc.

7.3.1    Business overview

7.3.2    Financial data

7.3.3    Product landscape

7.3.4    Strategic outlook

7.3.5    SWOT analysis

7.4    Allergan (AbbVie Inc.)

7.4.1    Business overview

7.4.2    Financial data

7.4.3    Product landscape

7.4.4    Strategic outlook

7.4.5    SWOT analysis

Proceed To Buy

USD 3800
USD 1900
USD 1200

Customization Offered

  • check-imgCross-segment Market Size and Analysis for Mentioned Segments
  • check-imgAdditional Company Profiles (Upto 5 With No Cost)
  • check-img Additional Countries (Apart From Mentioned Countries)
  • check-img Country/Region-specific Report
  • check-img Go To Market Strategy
  • check-imgRegion Specific Market Dynamics
  • check-imgRegion Level Market Share
  • check-img Import Export Analysis
  • check-imgProduction Analysis
  • check-imgOthers