Active Pharmaceutical Ingredients CDMO Market Size and Growth
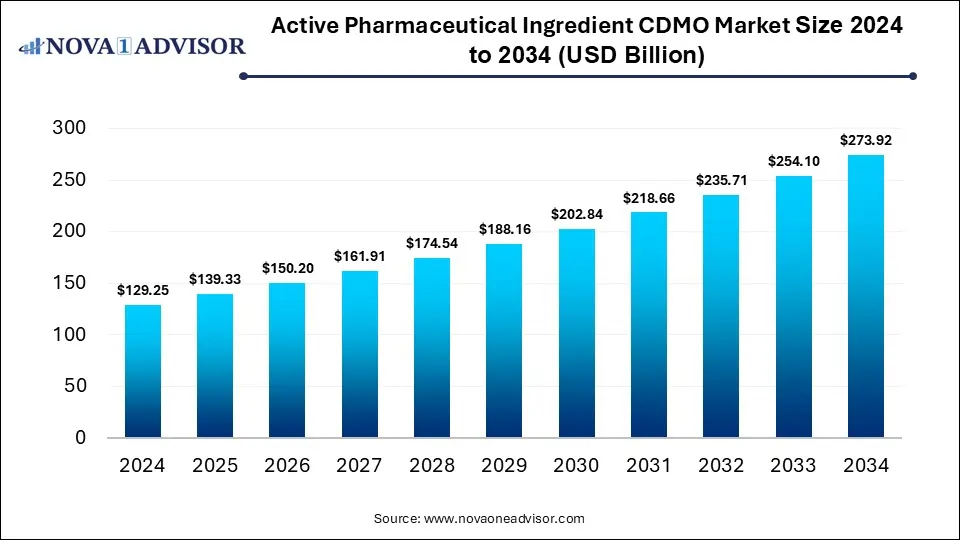
The global active pharmaceutical ingredients CDMO market size was valued at USD 129.25 billion in 2024 and is anticipated to reach around USD 273.92 billion by 2034, growing at a CAGR of 7.8% from 2025 to 2034.

Active Pharmaceutical Ingredients CDMO Market Key Takeaways
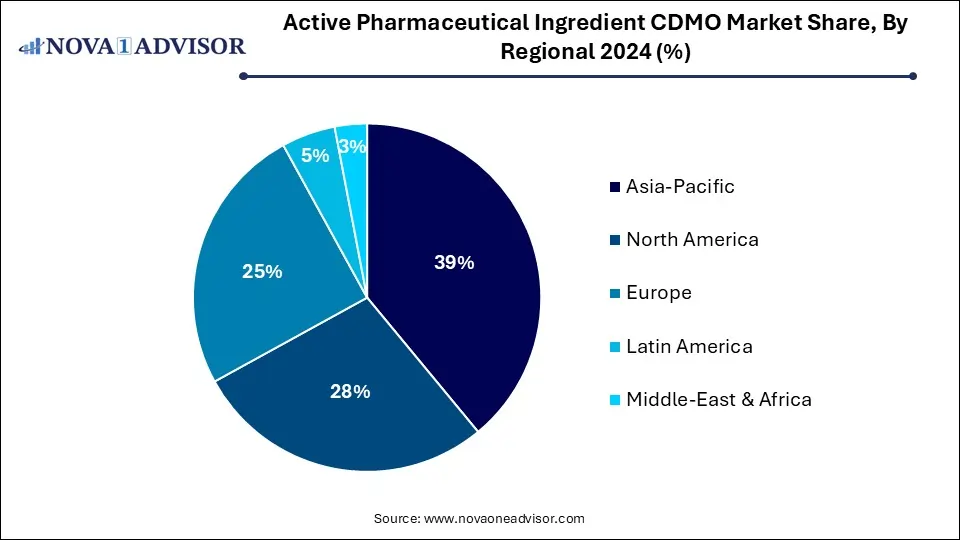
- Asia Pacific dominated the overall Active Pharmaceutical Ingredients CDMO market with a revenue share of 39% in 2024.
- The U.S. accounted for a dominant revenue share in the API CDMO market in North America in 2024.
- The traditional active pharmaceutical ingredients segment held the largest share of 40% in 2024.
- The antibody-drug conjugate segment is expected to show lucrative growth during the forecast period.
- The synthetic segment dominated the API CDMO market and accounted for the largest revenue share of 74% in 2024.
- The biotech segment is estimated to register a faster CAGR over the forecast period.
- The innovative drugs segment dominated the API CDMO market and accounted for the largest revenue share of 74% in 2024.
- The generic segment has been anticipated to showcase lucrative growth over the forecast period.
- The oncology segment dominated the active pharmaceutical ingredients CDMO market and accounted for the largest revenue share of 36% in 2024.
- The glaucoma segment has been anticipated to experience lucrative growth over the forecast period.
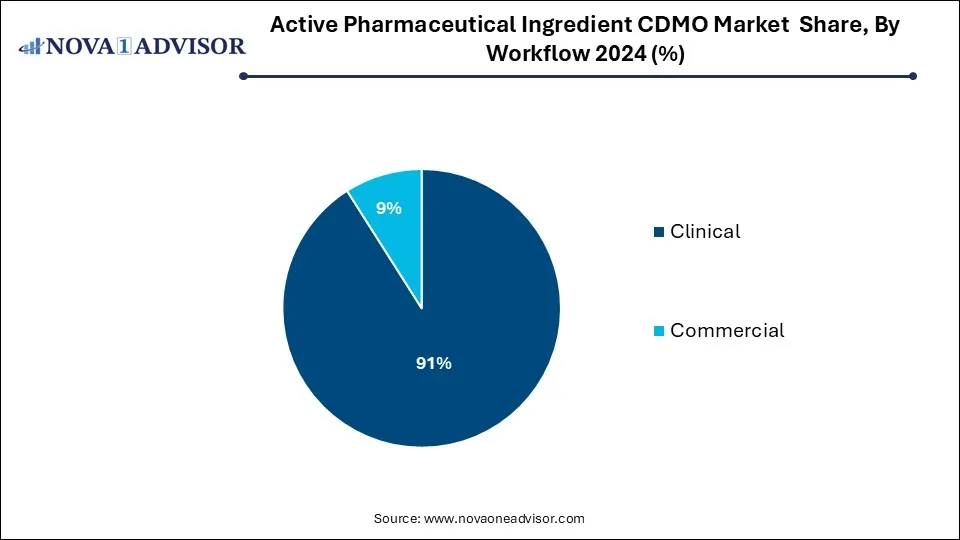
- The commercial segment held a dominant market share of 91% in 2024.
- The clinical segment has been anticipated to showcase lucrative growth over the forecast period.
Market Overview
The Active Pharmaceutical Ingredients (API) Contract Development and Manufacturing Organization (CDMO) market has become a critical segment within the global pharmaceutical value chain. With growing demands for new therapeutic agents, complex formulations, and stringent regulatory compliance, pharmaceutical companies are increasingly relying on CDMOs to provide scalable, cost-effective, and expertise-driven solutions for API production. API CDMOs offer comprehensive support from drug development to commercial-scale manufacturing, encompassing a wide range of services, including process development, custom synthesis, scale-up, analytical testing, and regulatory filing support.
The surge in outsourcing can be attributed to the pressures pharmaceutical companies face in reducing time-to-market and minimizing capital expenditure on infrastructure. With molecules becoming more complex and personalized, API production now demands specialized facilities, advanced technologies, and high-quality assurance processes that CDMOs are well-equipped to deliver. Moreover, the COVID-19 pandemic underscored the strategic importance of resilient and diversified supply chains, prompting pharmaceutical companies to partner more deeply with CDMOs for both innovative and generic drugs.
Major Trends in the Market
-
Increasing demand for highly potent APIs (HP-APIs) in oncology and targeted therapies
-
Expansion of biologics and antibody-drug conjugates (ADCs) in drug pipelines
-
Surge in demand for CDMOs offering end-to-end integrated services from clinical to commercial stages
-
Strategic reshoring of API manufacturing in North America and Europe for supply chain security
-
Growth in modular and continuous manufacturing technologies
-
Increasing regulatory scrutiny pushing quality, GMP compliance, and digital traceability
-
Collaborations between CDMOs and pharma/biotech companies for advanced synthetic routes and green chemistry
-
Rise of Asia-Pacific as a cost-competitive, innovation-driven CDMO hub
Active Pharmaceutical Ingredients CDMO Market Report Scope
| Report Attribute |
Details |
| Market Size in 2025 |
USD 139.33 Billion |
| Market Size by 2034 |
USD 273.92 Billion |
| Growth Rate From 2025 to 2034 |
CAGR of 7.8% |
| Base Year |
2024 |
| Forecast Period |
2025 to 2034 |
| Segments Covered |
Product, Synthesis, Drug, Application, Workflow, Region |
| Market Analysis (Terms Used) |
Value (US$ Million/Billion) or (Volume/Units) |
| Report Coverage |
Revenue forecast, company ranking, competitive landscape, growth factors, and trends |
| Key Companies Profiled |
Cambrex Corporation; Recipharm AB; Thermo Fisher Scientific Inc. (Pantheon); CordenPharma International; Samsung Biologics; Lonza; Catalent, Inc.; Siegfried Holding AG; Piramal Pharma Solutions; Boehringer Ingelheim International GmbH |
Asia Pacific Active Pharmaceutical Ingredients CDMO Market Size and Trends 2025 to 2034
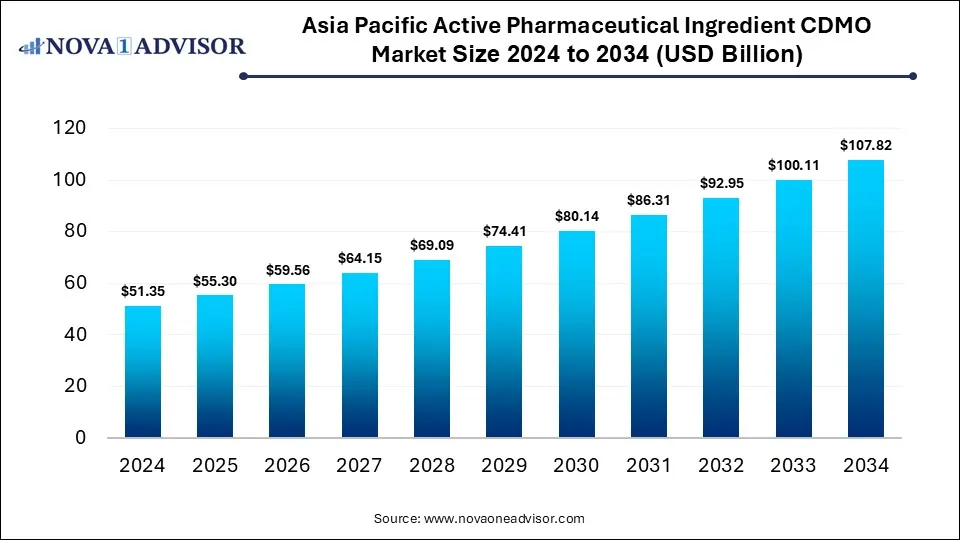
The Asia Pacific active pharmaceutical ingredients CDMO market size was valued at USD 51.35 billion in 2024 and is projected to surpass around USD 107.82 billion by 2034, registering a CAGR of 7.7% over the forecast period of 2025 to 2034.

Asia-Pacific is the fastest-growing region, led by India, China, and South Korea. India is known for its large-scale generic API manufacturing capabilities, while China is rapidly expanding its innovative API and biologics manufacturing sectors. Favorable labor costs, government incentives, and growing domestic pharmaceutical demand are positioning Asia-Pacific as a competitive and high-growth market for CDMO services. Global companies are increasingly partnering with APAC-based CDMOs for cost-effective clinical and commercial API supply.

North America dominates the global API CDMO market, driven by a strong pharmaceutical industry, advanced regulatory infrastructure, and high demand for novel drug development. The U.S. houses leading CDMOs like Cambrex, Catalent, and Thermo Fisher Scientific, which provide both synthetic and biologics manufacturing services. The region's emphasis on reshoring API production due to national security concerns has spurred investments in domestic capacity.
Active Pharmaceutical Ingredients CDMO Market By Synthesis Insights
Synthetic APIs currently lead the market, as the majority of small molecule drugs rely on chemical synthesis methods. CDMOs in this segment provide advanced capabilities in multi-step organic synthesis, chiral chemistry, and continuous flow processing. With increasing pressure for cost optimization and compliance, synthetic API CDMOs are improving process efficiencies, green chemistry adoption, and solvent recovery techniques.
Meanwhile, Biotech APIs are experiencing rapid growth, particularly in the form of biologics, peptides, and oligonucleotides. These require fermentation or cell culture-based production methods. The success of mRNA vaccines, gene therapies, and monoclonal antibodies is accelerating the shift toward biotech APIs. CDMOs with upstream biologics capabilities, bioreactor capacity, and expertise in purification and protein characterization are capturing growing demand, especially from emerging biopharma firms.
Active Pharmaceutical Ingredients CDMO Market By Drug Insights
Generic APIs form the dominant segment, as patent expirations of blockbuster drugs and global demand for affordable medicines continue to grow. CDMOs serving generic markets offer cost-effective solutions for high-volume API production with proven regulatory compliance. These operations focus on backward integration of intermediates, economies of scale, and margin-driven strategies.
Innovative drugs represent the fastest-growing segment, as pharmaceutical companies focus on novel compounds, specialty therapies, and orphan drugs. CDMOs supporting innovator clients must deliver high customization, stringent confidentiality, and adaptive project management. As drug development becomes more targeted and personalized, the role of CDMOs in accelerating early-phase clinical manufacturing and scaling to commercial production becomes more critical.
Active Pharmaceutical Ingredients CDMO Market By Application Insights
Oncology remains the dominant application area for API CDMO services, reflecting the large number of anti-cancer therapies in development and on the market. These APIs often involve HP-APIs, complex conjugates, or targeted delivery mechanisms, requiring specialized manufacturing expertise. Oncology drugs also have high value per dose, enabling CDMOs to invest in advanced containment and analytics capabilities.
Cardiovascular disease and diabetes APIs maintain steady demand, driven by high patient volumes and chronic disease prevalence. However, glaucoma and hormonal APIs are gaining ground, especially with the growth of personalized hormone therapies, women's health products, and ocular therapeutics. CDMOs offering niche capabilities in ophthalmic formulations and hormonal synthesis are expanding their service portfolios to address these therapeutic categories.
Active Pharmaceutical Ingredients CDMO Market By Workflow Insights
Commercial manufacturing dominates the workflow segment, as mature APIs in generic and branded markets require ongoing supply at large volumes. CDMOs in this category operate GMP-compliant facilities that serve as dedicated or multi-client manufacturing hubs. These services include tech transfer, process validation, and packaging support to meet global distribution needs.

Clinical development manufacturing is growing fastest, due to the rising number of small biopharma companies advancing early-phase trials. These firms typically lack in-house manufacturing capabilities and rely heavily on CDMOs for speed, agility, and regulatory guidance. Clinical manufacturing often demands small-batch, high-variability production with accelerated timelines. CDMOs that can offer integrated development, analytical services, and flexible batch sizes are well-positioned to serve this expanding client base.
Active Pharmaceutical Ingredients CDMO Market Recent Developments
-
March 2025: Cambrex announced the expansion of its High Potency API facility in Iowa, doubling its manufacturing capacity to meet increasing demand in oncology APIs.
-
January 2025: Lonza signed a $300 million strategic partnership with a major U.S. biotech firm to supply ADC payloads and linker technologies.
-
December 2024: WuXi STA opened a new continuous manufacturing API plant in China, emphasizing green chemistry and digital monitoring.
-
November 2024: Thermo Fisher Scientific acquired a specialized European CDMO to expand its HP-API and peptide production capabilities.
-
September 2024: Piramal Pharma Solutions inaugurated its expanded oligonucleotide API development center in Michigan, aimed at supporting next-gen RNA therapeutics.
Active Pharmaceutical Ingredients CDMO Market Top Key Companies:
The following are the leading companies in the active pharmaceutical ingredients CDMO market. These companies collectively hold the largest market share and dictate industry trends. Financials, strategy maps & products of these active pharmaceutical ingredients CDMO companies are analyzed to map the supply network.
Active Pharmaceutical Ingredients CDMO Market Report Segmentation
This report forecasts revenue growth at country levels and provides an analysis of the latest industry trends in each of the sub-segments from 2021 to 2034. For this study, Nova one advisor, Inc. has segmented the Active Pharmaceutical Ingredients CDMO market.
By Product
- Traditional Active Pharmaceutical Ingredients (Traditional API)
- Highly Potent Active Pharmaceutical Ingredients (HP-API)
- Antibody Drug Conjugate (ADC)
- Others
By Synthesis
By Drug
By Workflow
By Application
- Oncology
- Hormonal
- Glaucoma
- Cardiovascular disease
- Diabetes
- Others
By Region
- North America
- Europe
- Asia-Pacific
- Latin America
- Middle East & Africa (MEA)
List of Tables
- Table 1: Global API CDMO Market Size (USD Billion) by Product, 2024–2034
- Table 2: Global API CDMO Market Size (USD Billion) by Synthesis, 2024–2034
- Table 3: Global API CDMO Market Size (USD Billion) by Drug Type, 2024–2034
- Table 4: Global API CDMO Market Size (USD Billion) by Workflow, 2024–2034
- Table 5: Global API CDMO Market Size (USD Billion) by Application, 2024–2034
- Table 6: North America Market Size (USD Billion) by Product, 2024–2034
- Table 7: North America Market Size (USD Billion) by Synthesis, 2024–2034
- Table 8: North America Market Size (USD Billion) by Drug Type, 2024–2034
- Table 9: North America Market Size (USD Billion) by Workflow, 2024–2034
- Table 10: North America Market Size (USD Billion) by Application, 2024–2034
- Table 11: U.S. Market Size (USD Billion) by Product & Drug Type, 2024–2034
- Table 12: Canada Market Size (USD Billion) by Product & Drug Type, 2024–2034
- Table 13: Mexico Market Size (USD Billion) by Product & Drug Type, 2024–2034
- Table 14: Europe Market Size (USD Billion) by Product, 2024–2034
- Table 15: Europe Market Size (USD Billion) by Drug Type, 2024–2034
- Table 16: Germany Market Size (USD Billion) by Product & Drug Type, 2024–2034
- Table 17: France Market Size (USD Billion) by Product & Drug Type, 2024–2034
- Table 18: UK Market Size (USD Billion) by Product & Drug Type, 2024–2034
- Table 19: Italy Market Size (USD Billion) by Product & Drug Type, 2024–2034
- Table 20: Asia Pacific Market Size (USD Billion) by Product, 2024–2034
- Table 21: Asia Pacific Market Size (USD Billion) by Drug Type, 2024–2034
- Table 22: China Market Size (USD Billion) by Product & Drug Type, 2024–2034
- Table 23: Japan Market Size (USD Billion) by Product & Drug Type, 2024–2034
- Table 24: India Market Size (USD Billion) by Product & Drug Type, 2024–2034
- Table 25: South Korea Market Size (USD Billion) by Product & Drug Type, 2024–2034
- Table 26: Southeast Asia Market Size (USD Billion) by Product & Drug Type, 2024–2034
- Table 27: Latin America Market Size (USD Billion) by Product & Drug Type, 2024–2034
- Table 28: Brazil Market Size (USD Billion) by Product & Drug Type, 2024–2034
- Table 29: Middle East & Africa Market Size (USD Billion) by Product & Drug Type, 2024–2034
- Table 30: GCC Countries Market Size (USD Billion) by Product & Drug Type, 2024–2034
- Table 31: Turkey Market Size (USD Billion) by Product & Drug Type, 2024–2034
- Table 32: Africa Market Size (USD Billion) by Product & Drug Type, 2024–2034
- Figure 1: Global Market Share by Product, 2024
- Figure 2: Global Market Share by Synthesis, 2024
- Figure 3: Global Market Share by Drug Type, 2024
- Figure 4: Global Market Share by Workflow, 2024
- Figure 5: Global Market Share by Application, 2024
- Figure 6: North America Market Share by Product, 2024
- Figure 7: North America Market Share by Synthesis, 2024
- Figure 8: North America Market Share by Drug Type, 2024
- Figure 9: North America Market Share by Workflow, 2024
- Figure 10: North America Market Share by Application, 2024
- Figure 11: U.S. Market Share by Product, 2024
- Figure 12: U.S. Market Share by Drug Type, 2024
- Figure 13: Canada Market Share by Product, 2024
- Figure 14: Canada Market Share by Drug Type, 2024
- Figure 15: Mexico Market Share by Product, 2024
- Figure 16: Mexico Market Share by Drug Type, 2024
- Figure 17: Europe Market Share by Product, 2024
- Figure 18: Europe Market Share by Drug Type, 2024
- Figure 19: Germany Market Share by Product, 2024
- Figure 20: Germany Market Share by Drug Type, 2024
- Figure 21: France Market Share by Product, 2024
- Figure 22: France Market Share by Drug Type, 2024
- Figure 23: UK Market Share by Product, 2024
- Figure 24: UK Market Share by Drug Type, 2024
- Figure 25: Italy Market Share by Product, 2024
- Figure 26: Italy Market Share by Drug Type, 2024
- Figure 27: Asia Pacific Market Share by Product, 2024
- Figure 28: Asia Pacific Market Share by Drug Type, 2024
- Figure 29: China Market Share by Product, 2024
- Figure 30: China Market Share by Drug Type, 2024
- Figure 31: Japan Market Share by Product, 2024
- Figure 32: Japan Market Share by Drug Type, 2024
- Figure 33: India Market Share by Product, 2024
- Figure 34: India Market Share by Drug Type, 2024
- Figure 35: South Korea Market Share by Product, 2024
- Figure 36: South Korea Market Share by Drug Type, 2024
- Figure 37: Southeast Asia Market Share by Product, 2024
- Figure 38: Southeast Asia Market Share by Drug Type, 2024
- Figure 39: Latin America Market Share by Product, 2024
- Figure 40: Latin America Market Share by Drug Type, 2024
- Figure 41: Brazil Market Share by Product, 2024
- Figure 42: Brazil Market Share by Drug Type, 2024
- Figure 43: Middle East & Africa Market Share by Product, 2024
- Figure 44: Middle East & Africa Market Share by Drug Type, 2024
- Figure 45: GCC Countries Market Share by Product, 2024
- Figure 46: GCC Countries Market Share by Drug Type, 2024
- Figure 47: Turkey Market Share by Product, 2024
- Figure 48: Turkey Market Share by Drug Type, 2024
- Figure 49: Africa Market Share by Product, 2024
- Figure 50: Africa Market Share by Drug Type, 2024


