Barrier Coated Flexible Paper Packaging Market (Coating: Water-based Coating [Dispersion], Solvent-based Coating, Wax Coating, and Extrusion Coating; Application: Packaging and Printing; and End Use: Food, Beverages, Cosmetic, Pharmaceuticals, Building & Construction, Electrical & Electronics, and Others) - Europe Industry Analysis, Size, Share, Growth, Trends, and Forecast, 2023-2032

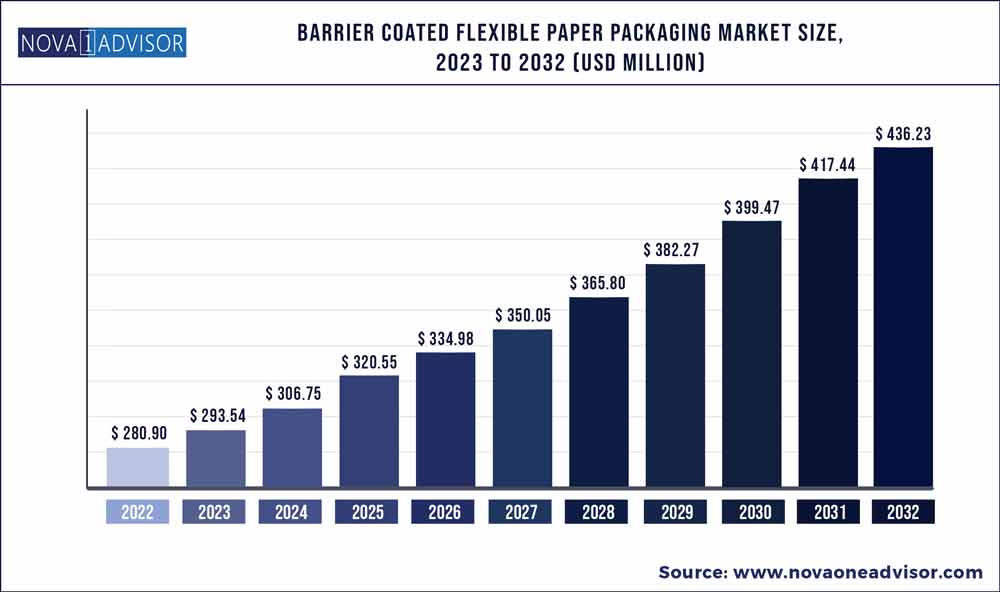
The Europe barrier coated flexible paper packaging market size was exhibited at USD 280.90 million in 2022 and is projected to hit around USD 436.23 million by 2032, growing at a CAGR of 4.5% during the forecast period 2023 to 2032.

barrier coated flexible paper packaging market size

Flourishing eCommerce Platforms Fuels Market Growth

Europe eCommerce sector has experienced significant market growth is the past couple of years, and likely to enjoy the same in the upcoming years. Shifting inclination toward online shopping among millennials has boosted the economic growth of the eCommerce sector and uplifted the sales of paper based packaging solutions.

Barrier coated flexible paper packaging solutions are predominantly used to pack and ship a wide range of industrial and non-industrial goods. Players operating in the eCommerce market is using this barrier coated flexible paper packaging as an effective marketing tool.

Barrier coated flexible paper packaging is witnessing consistent demand from the eCommerce sector, as it provides exceptional resistant against spoilage, damage, and wear-and-tear. All these factors are projected to fuel the barrier coated flexible paper packaging market growth during the forecast period.

Rise in Demand for Solvent and Water-based Coatings Bolsters Sales

Solvent and water-based coatings are extensively used as coatings on paper are used in specialty and consumer goods applications. These coatings can withstand high temperature, and possess better gas and moisture properties.

Solvent and water-based coatings are relatively cost-efficient and readily available. Hence, they are used in large quantities in packaging. Moreover, these coatings, especially water-based coatings, are biodegradable, which help in reducing the impact of environmental damage. All these factors are being recognized by packaging manufacturers, which results in high production of solvent and water-based coated paper packaging solutions.

Barrier Coated Flexible Paper Packaging Market Report Scope

Report Coverage

Details

Market Size in 2023

USD 293.54 million

Market Size by 2032

USD 436.23  million

Growth Rate from 2023 to 2032

CAGR of 4.5 %

Base year

2022

Forecast period

2023 to 2032

Segments covered

Coating Type, Application, End Use

Regional scope

Europe

Key companies profiled

Dow Chemical Company, UPM-Kymmene Oyj., Ahlstrom-Munksjö Oyj, BASF SE, Mitsubishi Paper Mills Limited, WestRock Company Billerudkorsnas AB, Sappi Ltd, Stora Enso Oyj., Mondi Plc., and Nippon Paper Industries Co., Ltd

Printing Availability on Barrier Coated Flexible Paper Packaging Supplement Sales

Leading brand owners from food, pharmaceutical, and electronics sectors are using printed and laminated barrier coated flexible paper packaging solutions for effective promotion of a wide range of food and non-food items. Incorporation of printing options such as digital and inkjet printing in barrier coated flexible paper packaging enable brand owners to differentiate their products from competitor’s products already available in the market.

Furthermore, printing on barrier coated flexible paper packaging enhance the look of the product, provide required information about the food and pharmaceuticals products, and gain attention of consumer towards the product. Rising usage of such printed barrier coated flexible paper packaging by industry players to attract major portion of the customers is driving the market growth substantially.

Europe Barrier Coated Flexible Paper Packaging Market: Key Findings

As per coating type, water-based coating (Dispersion) segment is anticipated to emerge as the most lucrative segment among others. The target segment is projected to hold approximately 2/4th portion of the market share by the end of 2030. Owing to its high strength barrier coating and excellent resistant against moisture, the target segment is projected to gain significant momentum during the foreseeable future. 

Based on end use, the food segment is expected to generate mammoth demand for barrier coated flexible paper packaging. The target segment is anticipated to offer total incremental opportunity of US$ 20.2 Mn over the next five years, and likely to expand 1.1 times to its market value during the next eight years. 

Germany is expected to hold significant market share during the forecast period. Increasing manufacturing activities and expanding food industry are driving this growth. Furthermore, lucrative growth opportunities for key players are expected in France and the U.K. These markets are forecast to create cumulative incremental opportunity of US$ 25.9 Mn by the end of 2030.

Barrier coated flexible paper is mostly preferred in packaging application over printing. Therefore, this segment is expected to increase at a growth rate of 3.8% during the forecast period.

Certified Hot, Cold Sealable Coatings for Paper Bolster Company Credibility

There is an increased hype for sustainable and recyclable materials in the Europe barrier coated flexible paper packaging market. However, such solutions need to undergo rigorous tests and approvals from regulatory authorities. Hence, manufacturers should increase their investments in R&D activities to innovate in sustainable and recyclable materials. For instance, Henkel is found in many talks for its hot- and cold-sealable coatings for paper that are certified for paper recycling.

Companies in the Europe barrier coated flexible paper packaging market are focusing on developing adhesives and coatings that help to improve the recyclability of paper packaging solutions whilst replacing plastic packaging.

Renewed Focus on Waste Reduction, Sustainability Boosts Market Growth

The enhancing sustainability in packaging materials has become a key focus point for stakeholders in the Europe barrier coated flexible paper packaging market. The ever-evolving consumer packaging industry is witnessing growing consciousness for sustainable solutions and is facing regulatory pressures. Hence, manufacturers are offering its product portfolio in eco-friendly, compostable, and recyclable heat seal barrier coatings that are compatible with stand-up pouch paper packaging.

Water-based Dispersions, Bio-based Materials Replace Extruded, Laminated Films

For package materials that are composed of paper, assuring that the package is resistant to moisture, oil, and grease can be potentially challenging. Companies in the Europe barrier coated flexible paper packaging market are seen to take a step further in water-based coatings for paper-based packaging to minimize the use of conventional coextruded or laminated polymeric films such as polyethylene.

Compared to an extruded polyolefin heat seal layer, a heat sealable coating made from water-based dispersions are enabling thinner coatings, less capital investment, and reduced material usage. Companies in the Europe barrier coated flexible paper packaging market have fixed their goal to minimize the use of extruded or laminated films and replace them with bio-based materials in paper and boardstock solutions.

Well-engineered Paper Packaging Reduces Reliance for Materials Based on Fossil Fuels

Manufacturers are boosting their output capacities in flexible packaging designed for recycling. Huhtamäki Oyj - a global food packaging specialist, headquartered in Espoo, Finland, is gaining recognition for its new blueloop™ paper solutions that are made from renewable raw materials and compounded with recycling capabilities. In order to gain a competitive edge in the Europe barrier coated flexible paper packaging market, companies are collaborating with sustainability experts and technical advisors to enable packaging designs for recycling.

Market understanding and experience are playing a key role in innovations in recyclable and renewable barrier coated flexible paper packaging solutions. Companies are producing well-engineered paper-based flexible packaging that reduces reliance on materials based on fossil fuels.

Some of the prominent players in the Barrier Coated Flexible Paper Packaging Market include:

  • Nippon Paper Industries Co., Ltd
  • Ahlstrom-Munksjö Oyj
  • Mitsubishi Paper Mills Limited
  • WestRock Company
  • Billerudkorsnas AB.
  • Solenis
  • International Paper Company
  • Graphic Packaging International
  • BASF SE
  • Dow Chemical Company
  • UPM-Kymmene Oyj.
  • Sappi Ltd
  • Stora Enso Oyj.
  • Mondi Plc
  • Gascogne Group
  • MetPro Group
  • PG Paper Company Ltd.
  • Feldmuehle GmbH
  • Nordic Paper AS, etc.

Segments Covered in the Report

This report forecasts revenue growth at country levels and provides an analysis of the latest industry trends in each of the sub-segments from 2018 to 2032. For this study, Nova one advisor, Inc. has segmented the Europe barrier coated flexible paper packaging market.

Barrier Coated Flexible Paper Packaging Market by Coating Type

  • Water-based Coating (Dispersion)
  • Solvent-based Coating
  • Wax Coating
  • Extrusion Coating

Barrier Coated Flexible Paper Packaging Market by Application

  • Packaging
    • Cups & Lids
    • Trays
    • Boxes
    • Bags & Pouches
    • Labels
    • Blisters
    • Wraps
    • Tapes
  • Printing

Barrier Coated Flexible Paper Packaging Market by End Use

  • Food
    • Bakery
    • Confectionery
    • Snacks
    • Dairy
    • Spices
    • Sauces
  • Beverages
  • Cosmetics
  • Pharmaceuticals
  • Building & Construction
  • Electrical & Electronics
  • Others (Publications, Automotive, etc.)

By Region

  • Germany
  • Spain
  • Italy
  • France
  • U.K.
  • BENELUX
  • Nordic
  • Russia
  • Poland
  • Rest of Europe

1. Executive Summary

    1.1. Market Overview

    1.2. Market Analysis

    1.3. Nova one advisor Analysis and Recommendations

2. Market Introduction

    2.1. Market Definition

    2.2. Market Taxonomy

3. Market Background

    3.1. Europe Packaging Industry Outlook

    3.2. Europe Food & Foodservice Market Overview

    3.3. Europe Pharmaceutical Market Overview

    3.4. Macro-Economic Factors and Co-relation Analysis

    3.5. Value Chain Analysis

        3.5.1. Exhaustive List of Active Participants

            3.5.1.1. Raw Material Suppliers

            3.5.1.2. Manufacturers

            3.5.1.3. End Users

        3.5.2. Profitability Margins

    3.6. Market Dynamics

        3.6.1. Drivers

        3.6.2. Restraints

        3.6.3. Opportunities

        3.6.4. Trends

4. Barrier Coated Flexible Paper Packaging Market Analysis

    4.1. Pricing Analysis

        4.1.1. Pricing Assumption

        4.1.2. Price Projections By Coating Type

    4.2. Market Value (US$ Mn) and Volume (Tons) Analysis & Forecast

    4.3. Y-o-Y Growth Projections

    4.4. Absolute $ Opportunity Analysis

5. Impact of Covid-19

6. Europe Barrier Coated Flexible Paper Packaging Analysis and Forecast, By Coating Type

    6.1. Section Summary

    6.2. Introduction

        6.2.1. Market share and Basis Points (BPS) Analysis By Coating Type

        6.2.2. Y-o-Y Growth Projections By Coating Type

    6.3. Historical Market Size (US$ Mn) and Volume (Tons) Analysis 2018-2023 By Coating Type

        6.3.1. Water-based Coating (Dispersion)

        6.3.2. Solvent-based Coating

        6.3.3. Wax Coating

        6.3.4. Extrusion Coating

    6.4. Market Size (US$ Mn) and Volume (Tons) Forecast 2023-2032, By Coating Type

        6.4.1. Water-based Coating (Dispersion)

        6.4.2. Solvent-based Coating

        6.4.3. Wax Coating

        6.4.4. Extrusion Coating

    6.5. Market Attractiveness Analysis By Coating Type

7. Europe Barrier Coated Flexible Paper Packaging Analysis and Forecast, By Application

    7.1. Section Summary

    7.2. Introduction

        7.2.1. Market share and Basis Points (BPS) Analysis By Application

        7.2.2. Y-o-Y Growth Projections By Application

    7.3. Historical Market Size (US$ Mn) and Volume (Tons) Analysis 2018-2023 By Application

        7.3.1. Packaging

            7.3.1.1. Cups & Lids

            7.3.1.2. Trays

            7.3.1.3. Boxes 

            7.3.1.4. Bags & Pouches 

            7.3.1.5. Labels

            7.3.1.6. Blisters

            7.3.1.7. Wraps

            7.3.1.8. Tapes

        7.3.2. Printing

    7.4. Market Size (US$ Mn) and Volume (Tons) Forecast 2023-2032, By Application

        7.4.1. Packaging

            7.4.1.1. Cups & Lids

            7.4.1.2. Trays

            7.4.1.3. Boxes 

            7.4.1.4. Bags & Pouches 

            7.4.1.5. Labels

            7.4.1.6. Blisters

            7.4.1.7. Wraps

            7.4.1.8. Tapes

        7.4.2. Printing

    7.5. Market Attractiveness Analysis By Application

8. Europe Barrier Coated Flexible Paper Packaging Analysis and Forecast, By End Use

    8.1. Section Summary

    8.2. Introduction

        8.2.1. Market share and Basis Points (BPS) Analysis By End Use

        8.2.2. Y-o-Y Growth Projections By End Use

    8.3. Historical Market Size (US$ Mn) and Volume (Tons) Analysis 2018-2023 By End Use

        8.3.1. Food

            8.3.1.1. Bakery

            8.3.1.2. Confectionery

            8.3.1.3. Snacks

            8.3.1.4. Dairy

            8.3.1.5. Spices 

            8.3.1.6. Sauces

        8.3.2. Beverages

        8.3.3. Cosmetics

        8.3.4. Pharmaceuticals

        8.3.5. Building & Construction

        8.3.6. Electrical & Electronics

        8.3.7. Others (Publications, Automotive, etc.)

    8.4. Market Size (US$ Mn) and Volume (Tons) Forecast 2023-2032, By End Use

        8.4.1. Food

            8.4.1.1. Bakery

            8.4.1.2. Confectionery

            8.4.1.3. Snacks

            8.4.1.4. Dairy

            8.4.1.5. Spices 

            8.4.1.6. Sauces

        8.4.2. Beverages

        8.4.3. Cosmetics

        8.4.4. Pharmaceuticals

        8.4.5. Building & Construction

        8.4.6. Electrical & Electronics

        8.4.7. Others (Publications, Automotive, etc.)

    8.5. Market Attractiveness Analysis By End Use

9. Europe Barrier Coated Flexible Paper Packaging Market Analysis and Forecast, By Region

    9.1. Section Summary

    9.2. Introduction

        9.2.1. Market share and Basis Points (BPS) Analysis By Region

        9.2.2. Y-o-Y Growth Projections By Region

    9.3. Historical Market Size (US$ Mn) and Volume (Tons) Analysis 2018-2023 By Region

        9.3.1. North America

        9.3.2. Latin America

        9.3.3. Europe

        9.3.4. Asia Pacific 

        9.3.5. Middle East and Africa (MEA)

    9.4. Market Size (US$ Mn) and Volume (Tons) Forecast 2023-2032 By Region

        9.4.1. North America

        9.4.2. Latin America

        9.4.3. Europe

        9.4.4. Asia Pacific 

        9.4.5. Middle East and Africa (MEA)

    9.5. Market Attractiveness Analysis By Region

10. Market Structure Analysis

    10.1. Market Analysis, by Tier of Companies

    10.2. Market Presence Analysis

        10.2.1. By Regional footprint of Players

        10.2.2. Channel footprint by Players

11. Competitive Landscape

    11.1. Competition Dashboard

    11.2. Company Market Share Analysis

    11.3. Company Profiles (Details – Overview, Financials, Strategy, Recent Developments, SWOT analysis)

    11.4. Competition Deep Dive 

        11.4.1. Barrier Coated Flexible Paper Packaging Manufacturers

            11.4.1.1. BASF SE

                11.4.1.1.1. Overview

                11.4.1.1.2. Product Portfolio

                11.4.1.1.3. Profitability

                11.4.1.1.4. Sales Footprint

                11.4.1.1.5. Competition Benchmarking

                11.4.1.1.6. Strategy

                    11.4.1.1.6.1. Marketing Strategy

                    11.4.1.1.6.2. Product Strategy

                    11.4.1.1.6.3. Channel Strategy

            11.4.1.2. Dow Chemical Company

                11.4.1.2.1. Overview

                11.4.1.2.2. Product Portfolio

                11.4.1.2.3. Profitability

                11.4.1.2.4. Sales Footprint

                11.4.1.2.5. Competition Benchmarking

                11.4.1.2.6. Strategy

                    11.4.1.2.6.1. Marketing Strategy

                    11.4.1.2.6.2. Product Strategy

                    11.4.1.2.6.3. Channel Strategy

            11.4.1.3. UPM-Kymmene Oyj

                11.4.1.3.1. Overview

                11.4.1.3.2. Product Portfolio

                11.4.1.3.3. Profitability

                11.4.1.3.4. Sales Footprint

                11.4.1.3.5. Competition Benchmarking

                11.4.1.3.6. Strategy

                    11.4.1.3.6.1. Marketing Strategy

                    11.4.1.3.6.2. Product Strategy

                    11.4.1.3.6.3. Channel Strategy

            11.4.1.4. Sappi Ltd

                11.4.1.4.1. Overview

                11.4.1.4.2. Product Portfolio

                11.4.1.4.3. Profitability

                11.4.1.4.4. Sales Footprint

                11.4.1.4.5. Competition Benchmarking

                11.4.1.4.6. Strategy

                    11.4.1.4.6.1. Marketing Strategy

                    11.4.1.4.6.2. Product Strategy

                    11.4.1.4.6.3. Channel Strategy

            11.4.1.5. Stora Enso Oyj.

                11.4.1.5.1. Overview

                11.4.1.5.2. Product Portfolio

                11.4.1.5.3. Profitability

                11.4.1.5.4. Sales Footprint

                11.4.1.5.5. Competition Benchmarking

                11.4.1.5.6. Strategy

                    11.4.1.5.6.1. Marketing Strategy

                    11.4.1.5.6.2. Product Strategy

                    11.4.1.5.6.3. Channel Strategy

            11.4.1.6. Mondi Plc.

                11.4.1.6.1. Overview

                11.4.1.6.2. Product Portfolio

                11.4.1.6.3. Profitability

                11.4.1.6.4. Sales Footprint

                11.4.1.6.5. Competition Benchmarking

                11.4.1.6.6. Strategy

                    11.4.1.6.6.1. Marketing Strategy

                    11.4.1.6.6.2. Product Strategy

                    11.4.1.6.6.3. Channel Strategy

            11.4.1.7. Nippon Paper Industries Co., Ltd

                11.4.1.7.1. Overview

                11.4.1.7.2. Product Portfolio

                11.4.1.7.3. Profitability

                11.4.1.7.4. Sales Footprint

                11.4.1.7.5. Competition Benchmarking

                11.4.1.7.6. Strategy

                    11.4.1.7.6.1. Marketing Strategy

                    11.4.1.7.6.2. Product Strategy

                    11.4.1.7.6.3. Channel Strategy

            11.4.1.8. Ahlstrom-Munksjö Oyj

                11.4.1.8.1. Overview

                11.4.1.8.2. Product Portfolio

                11.4.1.8.3. Profitability

                11.4.1.8.4. Sales Footprint

                11.4.1.8.5. Competition Benchmarking

                11.4.1.8.6. Strategy

                    11.4.1.8.6.1. Marketing Strategy

                    11.4.1.8.6.2. Product Strategy

                    11.4.1.8.6.3. Channel Strategy

            11.4.1.9. Mitsubishi Paper Mills Limited

                11.4.1.9.1. Overview

                11.4.1.9.2. Product Portfolio

                11.4.1.9.3. Profitability

                11.4.1.9.4. Sales Footprint

                11.4.1.9.5. Competition Benchmarking

                11.4.1.9.6. Strategy

                    11.4.1.9.6.1. Marketing Strategy

                    11.4.1.9.6.2. Product Strategy

                    11.4.1.9.6.3. Channel Strategy

            11.4.1.10. WestRock Company

                11.4.1.10.1. Overview

                11.4.1.10.2. Product Portfolio

                11.4.1.10.3. Profitability

                11.4.1.10.4. Sales Footprint

                11.4.1.10.5. Competition Benchmarking

                11.4.1.10.6. Strategy

                    11.4.1.10.6.1. Marketing Strategy

                    11.4.1.10.6.2. Product Strategy

                    11.4.1.10.6.3. Channel Strategy

            11.4.1.11. Billerudkorsnas AB

                11.4.1.11.1. Overview

                11.4.1.11.2. Product Portfolio

                11.4.1.11.3. Profitability

                11.4.1.11.4. Sales Footprint

                11.4.1.11.5. Competition Benchmarking

                11.4.1.11.6. Strategy

                    11.4.1.11.6.1. Marketing Strategy

                    11.4.1.11.6.2. Product Strategy

                    11.4.1.11.6.3. Channel Strategy

            11.4.1.12. Solenis

                11.4.1.12.1. Overview

                11.4.1.12.2. Product Portfolio

                11.4.1.12.3. Profitability

                11.4.1.12.4. Sales Footprint

                11.4.1.12.5. Competition Benchmarking

                11.4.1.12.6. Strategy

                    11.4.1.12.6.1. Marketing Strategy

                    11.4.1.12.6.2. Product Strategy

                    11.4.1.12.6.3. Channel Strategy

            11.4.1.13. International Paper Company

                11.4.1.13.1. Overview

                11.4.1.13.2. Product Portfolio

                11.4.1.13.3. Profitability

                11.4.1.13.4. Sales Footprint

                11.4.1.13.5. Competition Benchmarking

                11.4.1.13.6. Strategy

                    11.4.1.13.6.1. Marketing Strategy

                    11.4.1.13.6.2. Product Strategy

                    11.4.1.13.6.3. Channel Strategy

            11.4.1.14. Graphic Packaging International

                11.4.1.14.1. Overview

                11.4.1.14.2. Product Portfolio

                11.4.1.14.3. Profitability

                11.4.1.14.4. Sales Footprint

                11.4.1.14.5. Competition Benchmarking

                11.4.1.14.6. Strategy

                    11.4.1.14.6.1. Marketing Strategy

                    11.4.1.14.6.2. Product Strategy

                    11.4.1.14.6.3. Channel Strategy

            11.4.1.15. Gascogne Group

                11.4.1.15.1. Overview

                11.4.1.15.2. Product Portfolio

                11.4.1.15.3. Profitability

                11.4.1.15.4. Sales Footprint

                11.4.1.15.5. Competition Benchmarking

                11.4.1.15.6. Strategy

                    11.4.1.15.6.1. Marketing Strategy

                    11.4.1.15.6.2. Product Strategy

                    11.4.1.15.6.3. Channel Strategy

            11.4.1.16. MetPro Group

                11.4.1.16.1. Overview

                11.4.1.16.2. Product Portfolio

                11.4.1.16.3. Profitability

                11.4.1.16.4. Sales Footprint

                11.4.1.16.5. Competition Benchmarking

                11.4.1.16.6. Strategy

                    11.4.1.16.6.1. Marketing Strategy

                    11.4.1.16.6.2. Product Strategy

                    11.4.1.16.6.3. Channel Strategy

            11.4.1.17. PG Paper Company Ltd.

                11.4.1.17.1. Overview

                11.4.1.17.2. Product Portfolio

                11.4.1.17.3. Profitability

                11.4.1.17.4. Sales Footprint

                11.4.1.17.5. Competition Benchmarking

                11.4.1.17.6. Strategy

                    11.4.1.17.6.1. Marketing Strategy

                    11.4.1.17.6.2. Product Strategy

                    11.4.1.17.6.3. Channel Strategy

            11.4.1.18. Feldmuehle GmbH

                11.4.1.18.1. Overview

                11.4.1.18.2. Product Portfolio

                11.4.1.18.3. Profitability

                11.4.1.18.4. Sales Footprint

                11.4.1.18.5. Competition Benchmarking

                11.4.1.18.6. Strategy

                    11.4.1.18.6.1. Marketing Strategy

                    11.4.1.18.6.2. Product Strategy

                    11.4.1.18.6.3. Channel Strategy

            11.4.1.19. Nordic Paper AS

                11.4.1.19.1. Overview

                11.4.1.19.2. Product Portfolio

                11.4.1.19.3. Profitability

                11.4.1.19.4. Sales Footprint

                11.4.1.19.5. Competition Benchmarking

                11.4.1.19.6. Strategy

                    11.4.1.19.6.1. Marketing Strategy

                    11.4.1.19.6.2. Product Strategy

                    11.4.1.19.6.3. Channel Strategy

Proceed To Buy

USD 4500
USD 3800
USD 1900
USD 1200

Customization Offered

  • check-imgCross-segment Market Size and Analysis for Mentioned Segments
  • check-imgAdditional Company Profiles (Upto 5 With No Cost)
  • check-img Additional Countries (Apart From Mentioned Countries)
  • check-img Country/Region-specific Report
  • check-img Go To Market Strategy
  • check-imgRegion Specific Market Dynamics
  • check-imgRegion Level Market Share
  • check-img Import Export Analysis
  • check-imgProduction Analysis
  • check-imgOthers