Biofuel Market (Type: Biodiesel, Bioethanol, Bio-heavy Oil, and Others; and Feedstock: Corn, Sugarcane, Vegetable Oil, Palm Oil, and Others) - Global Industry Analysis, Size, Share, Growth, Trends, and Forecast, 2023-2032

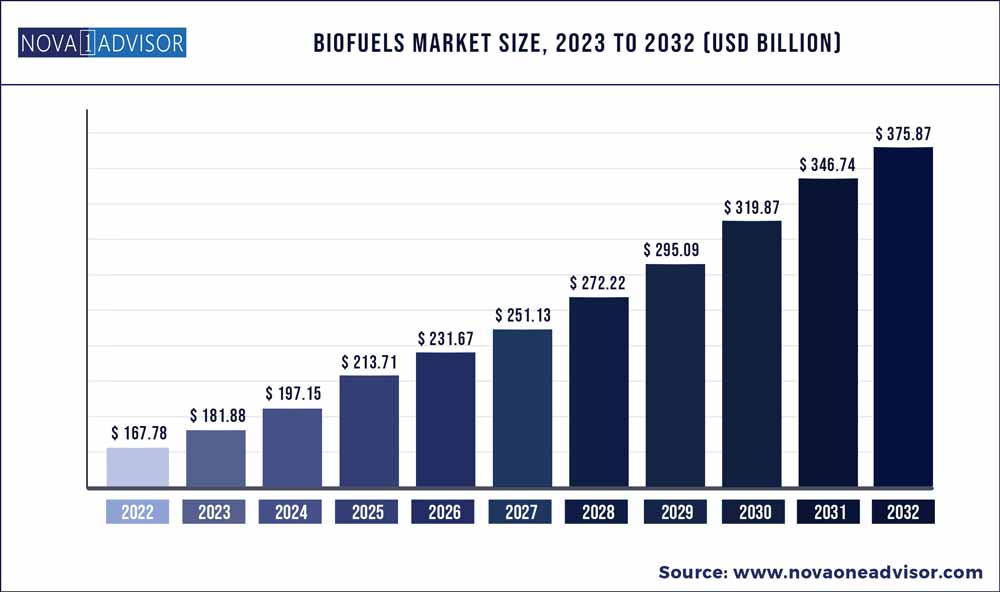
The global Biofuel market size was exhibited at USD 167.78 billion in 2022 and is projected to hit around USD 375.87 billion by 2032, growing at a CAGR of 8.4% during the forecast period 2023 to 2032.

Biofuel market size

Key Pointers:

  • The biofuel market, the bioethanol segment held major share of 68.9% in 2022. 
  • The vegetable oil segment dominated the global biofuel market and accounted for 29.19% share in 2022.
  • North America accounted for prominent share of 39.1% of the global market in 2022. 
  • These regions held 27.3% and 9.5 % share of the global market, respectively, in 2022.

Biofuel is derived from organic matter such as plants, algae, and animal waste. It plays an important role in reducing carbon dioxide emissions. Biofuels are renewable alternatives to conventional fuels such as gasoline, diesel, and kerosene. They can be used in passenger vehicles, trucks, ships, and airplanes. Currently, ethanol and biodiesel are the two common types of liquid biofuels. Ethanol is produced from corn and cellulosic feedstock such as crop residues and wood. Algae biofuels are an alternative to commonly known biofuel sources, such as corn and sugarcane. Vegetable oils, yellow grease, used cooking oils, or animal fats are used in the production of renewable diesel.

Biofuel Market Report Scope

Report Coverage

Details

Market Size in 2023

USD 181.88 Billion

Market Size by 2032

USD 375.87 Billion

Growth Rate from 2023 to 2032

CAGR of 8.4%

Base year

2022

Forecast period

2023 to 2032

Segments covered

Type, Feedstock, End-use

Regional scope

North America; Europe; Asia Pacific; Central and South America; the Middle East and Africa

Key companies profiled

Dow, Cargill, Inc., Archer-Daniels-Midland Company, BTG International Ltd., Renewable Energy Group, Inc., Enerkem, Drax Group, EnviTec Biogas AG, Green Plains, AR Energy Group, Abengoa Bioenergy SA, and VERBIO Vereinigte BioEnergie AG


Rise in Adoption of Renewable Energy Augmenting Market Demand for Biofuel

Biofuels can be used to limit greenhouse gas (GHG) and CO2 emissions. Fossil fuels are the main source of global warming. Adoption of biofuels can lead to lower GHG emissions, depending on the source and its circumstances. Thus, liquid biofuels help improve local air quality, reduce bio-waste, and protect ecosystems. Regulatory policies such as the Renewable Fuel Standard, a federal program that requires transportation fuel sold in the U.S. to contain a minimum volume of renewable fuels, encourage the adoption of biofuels. The EU Renewable Energy Directive (RED) stipulates that biofuels should have at least 50% lower emissions than their fossil fuel alternatives for installations in operation before October 2015, and 60% for installations starting after this date, rising to 65% lower for biofuel plants commencing operation after 1 January 2022.

Increase in the R&D of biofuels is expected to augment the global market during the forecast period. In October 2022, a study ‘Efficient process for xylitol production from nitric acid pretreated rice straw derived pentosans by Candida tropicalis GS18’, published in the Biomass and Bioenergy Journal identified a potential Candida tropicalis strain for efficient xylitol production. Xylitol is a natural sugar alcohol. Rye straw can be converted into fuel and xylitol.

Supply Security and Risk Abatement of Conventional Oil

Crude oil reserves are mostly concentrated in Middle East & Africa, the Americas, and Asia Pacific. However, reserves in these regions are witnessing high pressure due to rise in demand for fuel worldwide. This could be a basis for future conflicts between oil-producing nations aiming to secure remaining reserves for themselves. Thus, diversification of energy sources is a robust solution for risk abatement in this situation. South America, Russia, and Sub-Saharan Africa are some of the largest producers of biomass. Of these regions, only Russia has major fossil fuel deposits. Crude oil prices are volatile as natural and manmade events can potentially disrupt the supply of oil & gas. These include geopolitical risks, sanctions, crude inventory draws, and speculative positioning by oil producers. Therefore, other regions and countries are significantly investing in renewable energy to reduce their dependency on oil reserves.

Increase in Adoption of Bioethanol in Vehicles

In terms of type, the global biofuel market has been segregated into biodiesel, bioethanol, bio-heavy oil, and others. According to recent trends in the biofuel market, the bioethanol segment held major share of 68.9% in 2022. It is estimated to dominate the market during the forecast period. Bioethanol is a renewable fuel produced from various plant materials. It is used as a blending agent with gasoline to increase octane and cut down carbon monoxide and other smog-causing emissions. E10 is the most common blend of ethanol and is approved for use in most conventional gasoline-powered vehicles. Bioethanol is made from plant starches and sugars, particularly corn starch.

Rise in Production of Biofuel from Vegetable Oils

Based on feedstock, the global biofuel market has been classified into corn, sugarcane, vegetable oil, palm oil, and others. The vegetable oil segment dominated the global biofuel market and accounted for 29.19% share in 2022. Biodiesel can be produced from vegetable oils such as sunflower, soybean, rapeseed, and castor oil. Biodiesel production from vegetable oils is eco-friendly, as it recycles waste cooking oil and provides renewable energy with lower pollution.

 Global Biofuel Market Regional Outlook

North America accounted for prominent share of 39.1% of the global market in 2022. Implementation of stringent regulations is expected to boost adoption of biofuels in the region in the next few years. Under the Energy Independence and Security Act of 2007 of the U.S., the Renewable Fuel Standard mandates that 36 billion gallons per year (bg/y) of biofuels need to be produced by 2023.

Future of the biofuel market in Asia Pacific and Europe is promising with the rise in production of liquid biofuels in Southeast Asia and increase in launch of ethanol-powered vehicles. These regions held 27.3% and 9.5 % share of the global market, respectively, in 2022. Middle East & Africa and Latin America are relatively minor markets for biofuel compared to other regions.

Key Developments in Global Biofuel Market

  • In May 2019, United Airlines strengthened its reputation as the world's most environmentally conscious airline by renewing its contract with the U.S.-based World Energy. United Airlines agreed to purchase up to 10 million gallons of cost-competitive, commercial-scale, sustainable aviation biofuel over the next two years.
  • In January 2019, ExxonMobil Corporation and Renewable Energy Group (REG) announced the signing of a joint research agreement with Clariant to evaluate the potential use of cellulosic sugars from sources such as residues and agricultural waste to produce biofuel

Key players have been profiled in the biofuel market report based on parameters such as company overview, financial overview, business strategies, product portfolio, business segments, and recent developments.

Some of the prominent players in the Biofuel Market include:

  • Dow
  • Cargill, Inc.
  • Archer-Daniels-Midland Company
  • BTG International Ltd.,
  • Renewable Energy Group, Inc.
  • Enerkem
  • Drax Group PLC
  • EnviTec Biogas AG
  • Green Plains
  • AR Energy Group
  • Abengoa Bioenergy SA
  • VERBIO Vereinigte BioEnergie AG

Segments Covered in the Report

This report forecasts revenue growth at global, regional, and country levels and provides an analysis of the latest industry trends in each of the sub-segments from 2018 to 2032. For this study, Nova one advisor, Inc. has segmented the global Biofuel market.

By Type

  • Biodiesel
  • Bioethanol
  • Bio-heavy Oil
  • Others

By Feedstock

  • Corn
  • Sugarcane
  • Vegetable Oil
  • Palm Oil
  • Others

By End-use

  • Transport
  • Heat
  • Electricity

By Region

  • North America
  • Europe
  • Asia-Pacific
  • Latin America
  • Middle East & Africa (MEA)

Chapter 1. Introduction

1.1. Research Objective

1.2. Scope of the Study

1.3. Definition

Chapter 2. Research Methodology

2.1. Research Approach

2.2. Data Sources

2.3. Assumptions & Limitations

Chapter 3. Executive Summary

3.1. Market Snapshot

Chapter 4. Market Variables and Scope 

4.1. Introduction

4.2. Market Classification and Scope

4.3. Industry Value Chain Analysis

4.3.1. Raw Material Procurement Analysis 

4.3.2. Sales and Distribution Channel Analysis

4.3.3. Downstream Buyer Analysis

Chapter 5. COVID 19 Impact on Biofuel Market 

5.1. COVID-19 Landscape: Biofuel Industry Impact

5.2. COVID 19 - Impact Assessment for the Industry

5.3. COVID 19 Impact: Global Major Government Policy

5.4. Market Trends and Opportunities in the COVID-19 Landscape

Chapter 6. Market Dynamics Analysis and Trends

6.1. Market Dynamics

6.1.1. Market Drivers

6.1.2. Market Restraints

6.1.3. Market Opportunities

6.2. Porter’s Five Forces Analysis

6.2.1. Bargaining power of suppliers

6.2.2. Bargaining power of buyers

6.2.3. Threat of substitute

6.2.4. Threat of new entrants

6.2.5. Degree of competition

Chapter 7. Competitive Landscape

7.1.1. Company Market Share/Positioning Analysis

7.1.2. Key Strategies Adopted by Players

7.1.3. Vendor Landscape

7.1.3.1. List of Suppliers

7.1.3.2. List of Buyers

Chapter 8. Global Biofuel Market, By Type

8.1. Biofuel Market, by Type, 2023-2032

8.1.1 Biodiesel

8.1.1.1. Market Revenue and Forecast (2020-2032)

8.1.2. Bioethanol

8.1.2.1. Market Revenue and Forecast (2020-2032)

8.1.3. Bio-heavy Oil

8.1.3.1. Market Revenue and Forecast (2020-2032)

8.1.4. Others

8.1.4.1. Market Revenue and Forecast (2020-2032)

Chapter 9. Global Biofuel Market, By Feedstock

9.1. Biofuel Market, by Feedstock, 2023-2032

9.1.1. Corn

9.1.1.1. Market Revenue and Forecast (2020-2032)

9.1.2. Sugarcane

9.1.2.1. Market Revenue and Forecast (2020-2032)

9.1.3. Vegetable Oil

9.1.3.1. Market Revenue and Forecast (2020-2032)

9.1.4. Vegetable Oil

9.1.4.1. Market Revenue and Forecast (2020-2032)

9.1.5. Others

9.1.5.1. Market Revenue and Forecast (2020-2032)

Chapter 10. Global Biofuel Market, By End-use 

10.1. Biofuel Market, by End-use, 2023-2032

10.1.1. Transport

10.1.1.1. Market Revenue and Forecast (2020-2032)

10.1.2. Heat

10.1.2.1. Market Revenue and Forecast (2020-2032)

10.1.3. Electricity

Chapter 11. Global Biofuel Market, Regional Estimates and Trend Forecast

11.1. North America

11.1.1. Market Revenue and Forecast, by Type (2020-2032)

11.1.2. Market Revenue and Forecast, by Feedstock (2020-2032)

11.1.3. Market Revenue and Forecast, by End-use (2020-2032)

11.1.4. U.S.

11.1.4.1. Market Revenue and Forecast, by Type (2020-2032)

11.1.4.2. Market Revenue and Forecast, by Feedstock (2020-2032)

11.1.4.3. Market Revenue and Forecast, by End-use (2020-2032)

11.1.5. Rest of North America

11.1.5.1. Market Revenue and Forecast, by Type (2020-2032)

11.1.5.2. Market Revenue and Forecast, by Feedstock (2020-2032)

11.1.5.3. Market Revenue and Forecast, by End-use (2020-2032)

11.2. Europe

11.2.1. Market Revenue and Forecast, by Type (2020-2032)

11.2.2. Market Revenue and Forecast, by Feedstock (2020-2032)

11.2.3. Market Revenue and Forecast, by End-use (2020-2032)

11.2.4. UK

11.2.4.1. Market Revenue and Forecast, by Type (2020-2032)

11.2.4.2. Market Revenue and Forecast, by Feedstock (2020-2032)

11.2.4.3. Market Revenue and Forecast, by End-use (2020-2032)

11.2.5. Germany

11.2.5.1. Market Revenue and Forecast, by Type (2020-2032)

11.2.5.2. Market Revenue and Forecast, by Feedstock (2020-2032)

11.2.5.3. Market Revenue and Forecast, by End-use (2020-2032)

11.2.6. France

11.2.6.1. Market Revenue and Forecast, by Type (2020-2032)

11.2.6.2. Market Revenue and Forecast, by Feedstock (2020-2032)

11.2.6.3. Market Revenue and Forecast, by End-use (2020-2032)

11.2.7. Rest of Europe

11.2.7.1. Market Revenue and Forecast, by Type (2020-2032)

11.2.7.2. Market Revenue and Forecast, by Feedstock (2020-2032)

11.2.7.3. Market Revenue and Forecast, by End-use (2020-2032)

11.3. APAC

11.3.1. Market Revenue and Forecast, by Type (2020-2032)

11.3.2. Market Revenue and Forecast, by Feedstock (2020-2032)

11.3.3. Market Revenue and Forecast, by End-use (2020-2032)

11.3.4. India

11.3.4.1. Market Revenue and Forecast, by Type (2020-2032)

11.3.4.2. Market Revenue and Forecast, by Feedstock (2020-2032)

11.3.4.3. Market Revenue and Forecast, by End-use (2020-2032)

11.3.5. China

11.3.5.1. Market Revenue and Forecast, by Type (2020-2032)

11.3.5.2. Market Revenue and Forecast, by Feedstock (2020-2032)

11.3.5.3. Market Revenue and Forecast, by End-use (2020-2032)

11.3.6. Japan

11.3.6.1. Market Revenue and Forecast, by Type (2020-2032)

11.3.6.2. Market Revenue and Forecast, by Feedstock (2020-2032)

11.3.6.3. Market Revenue and Forecast, by End-use (2020-2032)

11.3.7. Rest of APAC

11.3.7.1. Market Revenue and Forecast, by Type (2020-2032)

11.3.7.2. Market Revenue and Forecast, by Feedstock (2020-2032)

11.3.7.3. Market Revenue and Forecast, by End-use (2020-2032)

11.4. MEA

11.4.1. Market Revenue and Forecast, by Type (2020-2032)

11.4.2. Market Revenue and Forecast, by Feedstock (2020-2032)

11.4.3. Market Revenue and Forecast, by End-use (2020-2032)

11.4.4. GCC

11.4.4.1. Market Revenue and Forecast, by Type (2020-2032)

11.4.4.2. Market Revenue and Forecast, by Feedstock (2020-2032)

11.4.4.3. Market Revenue and Forecast, by End-use (2020-2032)

11.4.5. North Africa

11.4.5.1. Market Revenue and Forecast, by Type (2020-2032)

11.4.5.2. Market Revenue and Forecast, by Feedstock (2020-2032)

11.4.5.3. Market Revenue and Forecast, by End-use (2020-2032)

11.4.6. South Africa

11.4.6.1. Market Revenue and Forecast, by Type (2020-2032)

11.4.6.2. Market Revenue and Forecast, by Feedstock (2020-2032)

11.4.6.3. Market Revenue and Forecast, by End-use (2020-2032)

11.4.7. Rest of MEA

11.4.7.1. Market Revenue and Forecast, by Type (2020-2032)

11.4.7.2. Market Revenue and Forecast, by Feedstock (2020-2032)

11.4.7.3. Market Revenue and Forecast, by End-use (2020-2032)

11.5. Latin America

11.5.1. Market Revenue and Forecast, by Type (2020-2032)

11.5.2. Market Revenue and Forecast, by Feedstock (2020-2032)

11.5.3. Market Revenue and Forecast, by End-use (2020-2032)

11.5.4. Brazil

11.5.4.1. Market Revenue and Forecast, by Type (2020-2032)

11.5.4.2. Market Revenue and Forecast, by Feedstock (2020-2032)

11.5.4.3. Market Revenue and Forecast, by End-use (2020-2032)

11.5.5. Rest of LATAM

11.5.5.1. Market Revenue and Forecast, by Type (2020-2032)

11.5.5.2. Market Revenue and Forecast, by Feedstock (2020-2032)

11.5.5.3. Market Revenue and Forecast, by End-use (2020-2032)

Chapter 12. Company Profiles

12.1. Dow

12.1.1. Company Overview

12.1.2. Product Offerings

12.1.3. Financial Performance

12.1.4. Recent Initiatives

12.2. Cargill, Inc.

12.2.1. Company Overview

12.2.2. Product Offerings

12.2.3. Financial Performance

12.2.4. Recent Initiatives

12.3. Archer-Daniels-Midland Company

12.3.1. Company Overview

12.3.2. Product Offerings

12.3.3. Financial Performance

12.3.4. Recent Initiatives

12.4. BTG International Ltd.,

12.4.1. Company Overview

12.4.2. Product Offerings

12.4.3. Financial Performance

12.4.4. Recent Initiatives

12.5. Renewable Energy Group, Inc.

12.5.1. Company Overview

12.5.2. Product Offerings

12.5.3. Financial Performance

12.5.4. Recent Initiatives

12.6. Enerkem

12.6.1. Company Overview

12.6.2. Product Offerings

12.6.3. Financial Performance

12.6.4. Recent Initiatives

12.7. Drax Group PLC

12.7.1. Company Overview

12.7.2. Product Offerings

12.7.3. Financial Performance

12.7.4. Recent Initiatives

12.8. EnviTec Biogas AG

12.8.1. Company Overview

12.8.2. Product Offerings

12.8.3. Financial Performance

12.8.4. Recent Initiatives

12.9. Green Plains

12.9.1. Company Overview

12.9.2. Product Offerings

12.9.3. Financial Performance

12.9.4. Recent Initiatives

12.10. AR Energy Group

12.10.1. Company Overview

12.10.2. Product Offerings

12.10.3. Financial Performance

12.10.4. Recent Initiatives

Chapter 13. Research Methodology

13.1. Primary Research

13.2. Secondary Research

13.3. Assumptions

Chapter 14. Appendix

14.1. About Us

14.2. Glossary of Terms

Proceed To Buy

USD 4500
USD 3800
USD 1900
USD 1200

Customization Offered

  • check-imgCross-segment Market Size and Analysis for Mentioned Segments
  • check-imgAdditional Company Profiles (Upto 5 With No Cost)
  • check-img Additional Countries (Apart From Mentioned Countries)
  • check-img Country/Region-specific Report
  • check-img Go To Market Strategy
  • check-imgRegion Specific Market Dynamics
  • check-imgRegion Level Market Share
  • check-img Import Export Analysis
  • check-imgProduction Analysis
  • check-imgOthers