Breast Cancer Therapeutics Market Size and Growth
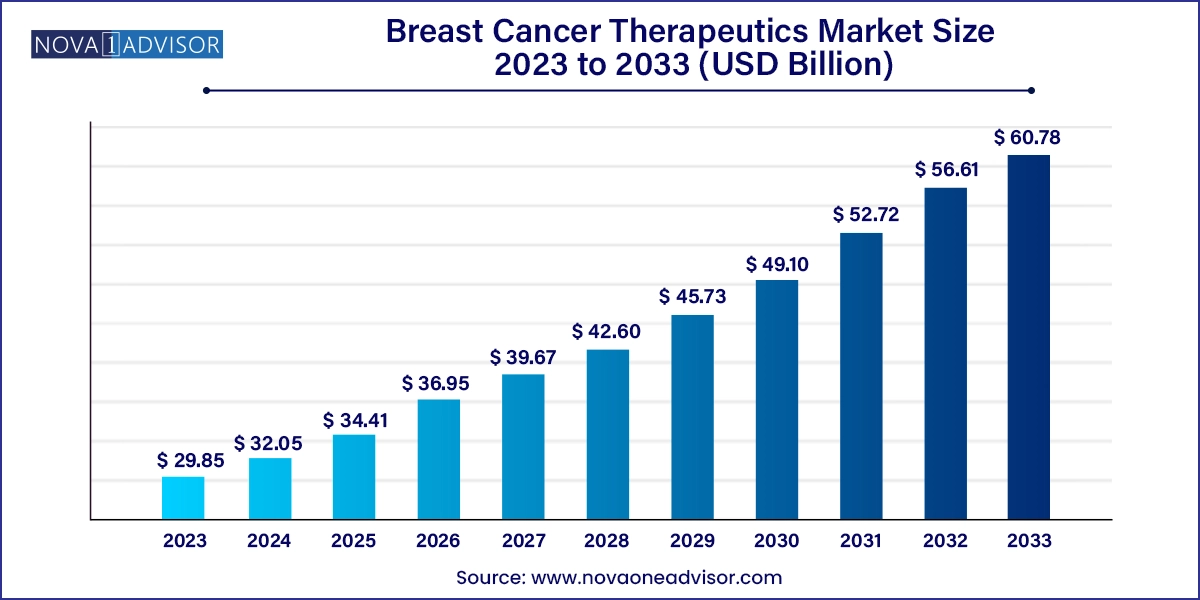
The global breast cancer therapeutics market size was valued at USD 29.85 billion in 2023 and is anticipated to reach around USD 60.78 billion by 2033, growing at a CAGR of 7.37% from 2024 to 2033.

Breast Cancer Therapeutics Market Key Takeaways
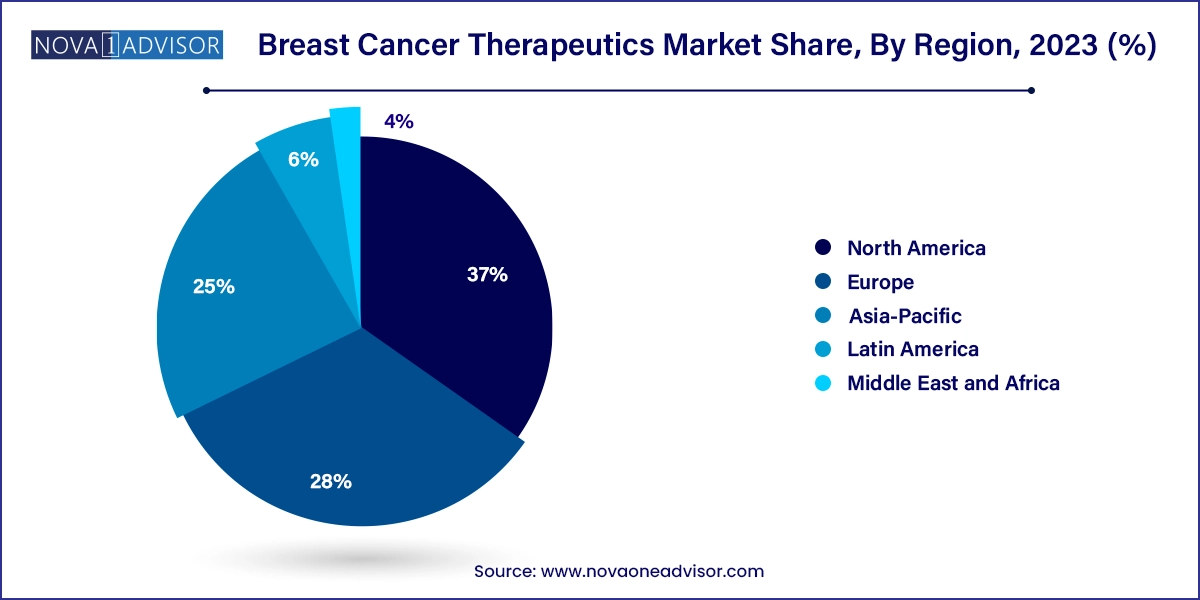
- North America dominated the global breast cancer therapeutics market share of 37% in 2023.
- Europe is expected to hold a significant share of the market over the forecast period.
- By therapy type, the targeted therapy segment held the dominant share in 2023.
- By therapy type, the hormonal therapy segment is anticipated to show decent growth during the forecast period.
- By cancer type, the hormone receptor segment held the largest share of the market in 2023.
- By cancer type, the HER2+ segment is anticipated to show a higher CAGR in the forecast period.
- By distribution channel, the hospital pharmacies segment held the largest share of the market in 2023.
- By distribution channel, the retail pharmacies segment is anticipated to hold a significant share in the forecast period.
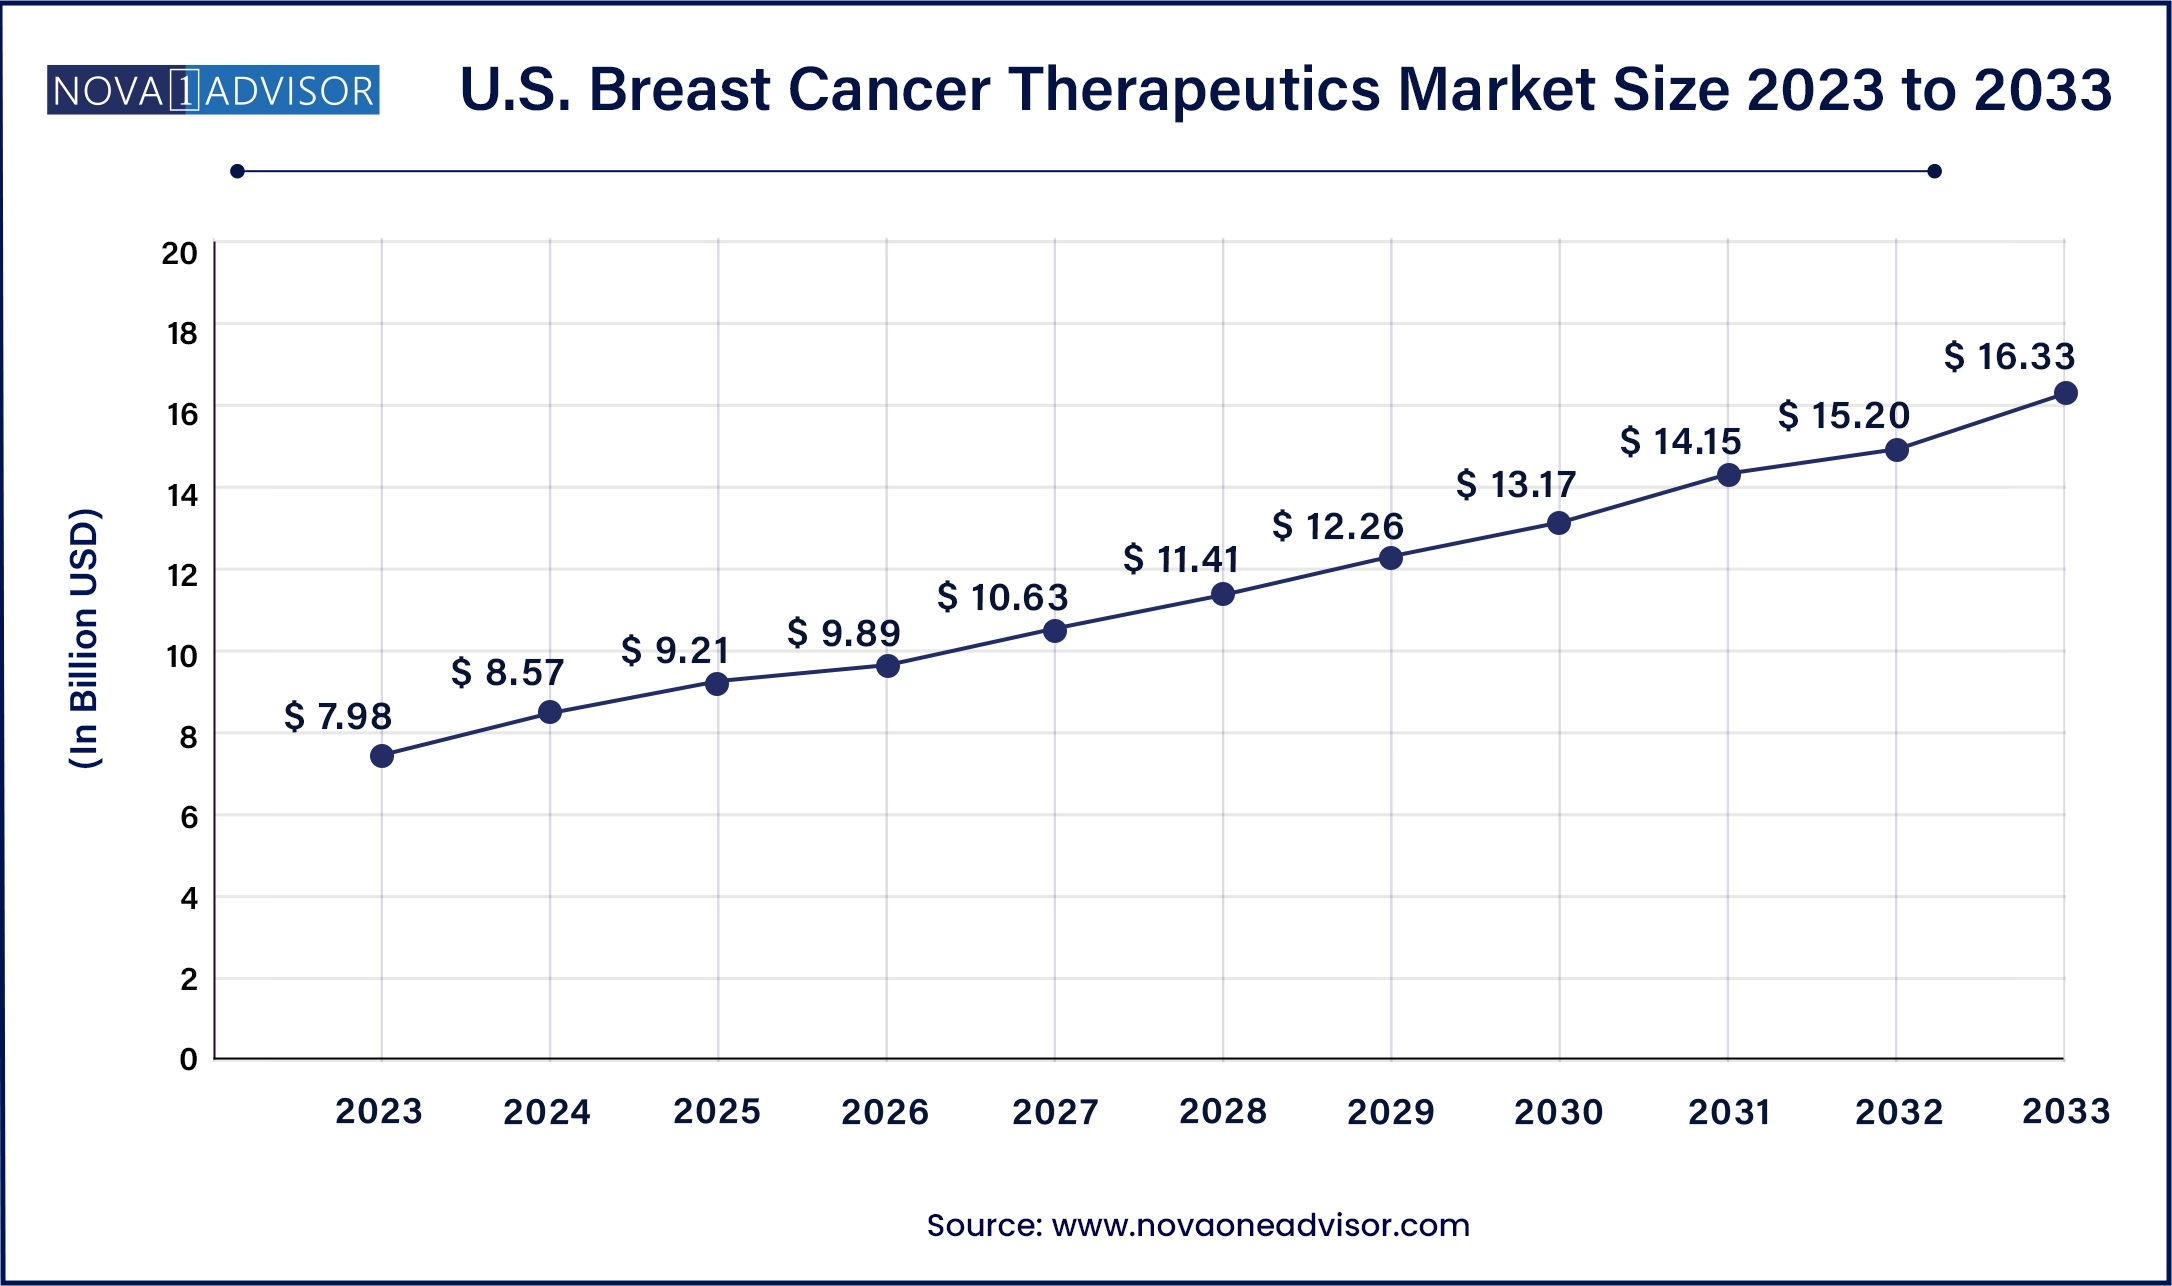
U.S. Breast Cancer Therapeutics Market Size and Growth 2024 to 2033
The U.S. breast cancer therapeutics market size reached USD 7.98 billion in 2023 and is anticipated to surpass around USD 16.33 billion by 2033, poised to grow at a CAGR of 7.42% from 2024 to 2033.

North America led the market with the biggest market share of 37% in 2023. Ongoing research initiatives supported by organizations like Susan G. Komen enhance our understanding of breast cancer biology and improve treatment outcomes. Furthermore, regulatory approvals, such as the FDA's authorization of Trodelvy for treating triple-negative breast cancer, indicate ongoing progress in therapeutic innovation and patient care in North America.

- In the U.S., approximately 1 in 8 women are affected by breast cancer during their lifetime, and it is expected that around 287,850 new cases of invasive breast cancer will be diagnosed among women in 2022. It's worth noting that breast cancer also affects men, with an estimated 2,710 new cases projected for the same year.
- In August 2022, the U.S. Food and Drug Administration gave the green light to Enhertu (fam-trastuzumab-deruxtecan-nxki), an intravenous infusion designed to treat individuals with HER2-low breast cancer that is either inoperable or has spread to other parts of the body.
Europe is expected to hold a significant share of the breast cancer therapeutics market over the forecast period, mainly due to the rising incidence of breast cancer and increased adoption of advanced therapies. Among European countries, breast cancer is a prevalent form, accounting for about 523,000 new cases, which is 13% of all cancer cases in the region. Other common types of cancer include colorectal, lung, and prostate cancers. Despite improvements in healthcare infrastructure and cancer management, Europe faces challenges like demographic shifts, healthcare access issues, and disparities in cancer outcomes among different population groups.
Breast Cancer Therapeutics Market Overview
The breast cancer therapeutics market is a dynamic sector within oncology focused on developing and delivering treatments for breast cancer, one of the most prevalent and significant health challenges globally. This market encompasses a wide range of therapeutic approaches, including chemotherapy, hormone therapy, targeted therapy, and immunotherapy, tailored to different subtypes and stages of breast cancer. Advances in understanding the molecular basis of breast cancer have driven the development of new treatments, aiming to improve survival rates, minimize side effects, and enhance quality of life for patients. The market continues to evolve with ongoing research, clinical trials, and innovations in personalized medicine, aiming to address the diverse needs of patients worldwide.
Breast Cancer Therapeutics Market Report Scope
| Report Attribute |
Details |
| Market Size in 2024 |
USD 32.05 Billion |
| Market Size by 2033 |
USD 60.78 Billion |
| Growth Rate From 2024 to 2033 |
CAGR of 7.37% |
| Base Year |
2023 |
| Forecast Period |
2024 to 2033 |
| Segments Covered |
By Therapy, By Cancer Type, and By Distribution Channel |
| Market Analysis (Terms Used) |
Value (US$ Million/Billion) or (Volume/Units) |
| Report Coverage |
Revenue forecast, company ranking, competitive landscape, growth factors, and trends |
| Key Companies Profiled |
Pfizer, Novartis, Roche, AstraZeneca, Eli Lilly and Company, Merck & Co., Inc., Bristol-Myers Squibb, Sanofi, Johnson & Johnson, AbbVie Inc., Gilead Sciences, Celgene Corporation, Eisai Co., Ltd., Takeda Pharmaceutical Company Limited, Amgen Inc., Teva Pharmaceutical Industries Ltd., Mylan N.V., Daiichi Sankyo Company, Limited, Otsuka Pharmaceutical Co., Ltd., Ipsen, and Others. |
Breast Cancer Therapeutics Market Growth Factors
Increasing Incidence of Breast Cancer: Breast cancer remains one of the most prevalent cancers globally, with rising incidences reported worldwide. This drives the demand for effective treatment options, thereby boosting the market growth.
Advancements in Treatment Options: Significant advancements in treatment modalities, including targeted therapies, immunotherapies, and personalized medicine approaches, have expanded treatment options for breast cancer patients. These innovations improve survival rates and quality of life, driving market growth.
Rising Healthcare Expenditure: Globally, there has been an increase in healthcare expenditure, particularly in oncology. This allows for greater access to advanced therapies and supportive care, contributing to market expansion.
Technological Advancements in Diagnostic Tools: Improved diagnostic technologies, such as genetic testing and molecular diagnostics, enable early detection and personalized treatment strategies. Early detection often leads to better treatment outcomes and increases the demand for therapeutic interventions.
Government Initiatives and Funding: Many governments and organizations worldwide are investing in cancer research, awareness programs, and healthcare infrastructure development. This support accelerates drug development, clinical trials, and patient access to novel therapies.
Growing Aging Population: The aging population is more susceptible to cancer, including breast cancer. As the global population ages, there is a natural increase in the incidence of breast cancer cases, which fuels market growth.
Breast Cancer Therapeutics Market Dynamics
Driver
Disparities in cancer care and treatment
Disparities in cancer care and treatment access highlight the urgent need for improved global healthcare infrastructure and services. Disparities in cancer outcomes are linked to human development levels, with countries having lower Human Development Index (HDI) facing higher breast cancer mortality rates due to late diagnosis and inadequate access to quality treatment. These findings underscore the importance of addressing cancer inequities and investing in comprehensive cancer care infrastructure to enhance outcomes for breast cancer patients worldwide, potentially contributing to the growth of the breast cancer therapeutics market.
- The World Health Organization's (WHO) survey on Universal Health Coverage (UHC) and cancer revealed significant gaps in cancer management and palliative care services across participating countries. Only 39% of countries included the basics of cancer management in their core health services for all citizens.
Restraint
High treatment costs
The significant expenses linked to breast cancer therapeutics pose challenges to accessibility in the breast cancer therapeutics market, especially in areas with constrained healthcare resources. For example, advanced targeted treatments like trastuzumab (Herceptin) may impose a financial burden on numerous patients, limiting their ability to afford crucial treatments. Inequities in access persist, with underserved populations encountering difficulties in obtaining timely diagnoses and suitable therapies due to restricted healthcare infrastructure and geographical obstacles.
Opportunities
Advancements in targeted therapies and immunotherapies improve breast cancer patient outcomes
Advancements in the diagnosis and treatment of breast cancer are propelling the growth of the breast cancer therapeutics market. Targeted therapies and immunotherapies have transformed breast cancer treatment, providing more effective and less toxic options for patients. Additionally, the global cancer burden, including breast cancer, is increasing, with a surge in new cases and deaths fueling market expansion.
- According to the World Health Organization (WHO), there were approximately 20 million new cancer cases and 9.7 million deaths worldwide in 2022. Breast cancer stands as the second most common cancer globally, with around 2.3 million new cases, accounting for 11.6% of total new cancer cases. It is a significant cause of cancer-related deaths, with 670,000 reported deaths in 2022, constituting 6.9% of total cancer deaths.
Breast Cancer Therapeutics Market by Advancement in diagnosis
The breast cancer therapeutics market is moving towards more focused and accurate treatments like HER2-targeted and hormone therapies. These advances have enhanced patient outcomes and survival rates. Additionally, there's a rise in the development of immunotherapies and combination therapies, providing new treatment choices with improved effectiveness. Furthermore, government support, research and development investments, and collaborations between pharmaceutical companies and research institutions drive market growth.
- In May 2022, Roche introduced PHESGO to treat HER-2-positive breast cancer in India. PHESGO is the first-ever fixed-dose formulation in cancer treatment, combining two monoclonal antibodies. This innovative approach aims to enhance the effectiveness of breast cancer treatment.
Breast Cancer Therapeutics Market by Therapy Type Insights
The targeted therapy segment held the dominant share of the breast cancer therapeutics market in 2023. Targeted therapy has become increasingly prominent due to its efficacy and fewer side effects than traditional chemotherapy. In breast cancer, targeted drug therapy involves medications directed at specific proteins in cancer cells, hindering their growth, spread, and longevity. These drugs aim to destroy cancer cells or impede their growth, exhibiting different side effects than chemotherapy. Trastuzumab demonstrated improved overall survival in late-stage breast cancer, extending from 20.3 to 25.1 months. In early-stage breast cancer, it reduced the risk of cancer recurrence after surgery by 9.5% and the risk of death by 3%.
The hormonal therapy segment is anticipated to show decent growth during the forecast period. Hormone therapy has become a crucial component in breast cancer treatment, particularly for estrogen receptor-positive tumors, leading to a significant reduction in recurrence rates. This therapy, also known as hormonal therapy or endocrine therapy, hinders the growth of hormone-sensitive tumors by either blocking the body's hormone production or interfering with hormones' effects on breast cancer cells. Typically administered after surgery to lower the risk of cancer recurrence (adjuvant therapy), it may also be initiated before surgery (neoadjuvant treatment).
The standard duration is at least five years. In some cases, therapy beyond five years might be recommended based on the likelihood of cancer recurrence, determined by tests like the breast cancer Index. Hormone therapy is also employed to treat cancer that has returned after initial treatment or has spread to other parts of the body.
Breast Cancer Therapeutics Market by Cancer Type Insights
The hormone receptor segment held the largest share of the breast cancer therapeutics market in 2023. Hormone receptors, which are large protein molecules located on target cells, play a crucial role in cell communication. Each cell typically has thousands of these receptors, and an essential feature is their specificity—each receptor can recognize only one hormone. Therefore, a hormone's corresponding receptor must be present to exert its effects on a target cell, in the context of breast cells, hormone receptors, specifically estrogen or progesterone, act as signal receivers, promoting cell growth. This includes the growth of cancer cells if they possess the receptors for these hormones.
The HER2+ segment is anticipated to show a higher CAGR in the breast cancer therapeutics market over the forecast period. This is attributed to recent product launches and market acquisitions. In breast cells, an excess of human epidermal growth factor receptor 2 (HER2) is a common feature tested for. HER2 proteins are receptors that govern the growth and division of cells. If there is an overexpression of HER2 receptors in breast tissue, it can lead to an accelerated multiplication of breast cells.
An article from Cancer Therapy Advisor in December 2023 suggests that a potential new standard of care for individuals with PIK3CA-mutant, hormone receptor (HR)-positive, HER2-negative advanced breast cancer could involve combining Inavolisib with palbociclib and fulvestrant. In the phase 3 INAVO120 trial, researchers observed that adding Inavolisib to this treatment combination doubled the median progression-free survival (PFS).
Breast Cancer Therapeutics Market by Distribution Channel Insights
The hospital pharmacies segment held the dominating share of the market in 2023, the segment is observed to sustain the position in the breast cancer therapeutics market during the forecast period. This is attributed to the growing dependence of patients on chemotherapy-related drugs. The demand for breast cancer treatments will increase during this period, fueled by rising patient needs for diverse pharmaceuticals. Furthermore, improved accessibility to these products in hospital pharmacies contributes to the anticipated market expansion.
- In November 2023, Aster Royal Al Raffah Hospital in Oman took a significant step in healthcare by launching the Aster Al Raffah Breast Cancer Clinic. This specialized facility is dedicated to early detection and comprehensive management of breast cancer and related disorders.
The retail pharmacies segment is anticipated to hold a significant share in the forecast period. Pharmacists have a significant role in managing postmenopausal breast cancer and vasomotor symptoms. They contribute by educating patients and suggesting medications in line with treatment guidelines. This involves considering potential side effects and drug interactions.
Breast Cancer Therapeutics Market Recent Developments
- In February 2023, GenoPharma Inc. completed Phase III clinical trials for their new targeted therapy for HER2-positive breast cancer.
- In April 2023, MedSolution Pharmaceuticals introduced a groundbreaking immunotherapy treatment for triple-negative breast cancer called ImmunoClearTM. This therapy utilizes the patient's immune system to target and eliminate cancer cells selectively, leading to improved response rates and extended progression-free survival.
- In June 2023, Global Biotech Corporation launched a precision medicine approach for hormone receptor-positive breast cancer, improving treatment outcomes and reducing side effects.
- In September 2022, Novartis announced results from a new pooled exploratory analysis across the entire MONALEESA Phase III program, confirming nearly one year of additional overall survival (OS) benefit in a subgroup of patients with aggressive forms of hormone receptor-positive, human epidermal growth factor receptor-2 negative (HR+/HER2-) advanced breast cancer (ABC).
Breast Cancer Therapeutics Market Top Key Companies:
- Pfizer (USA)
- Novartis (Switzerland)
- Roche (Switzerland)
- AstraZeneca (UK)
- Eli Lilly and Company (U.S.)
- Merck & Co., Inc. (U.S.)
- Bristol-Myers Squibb (U.S.)
- Sanofi (France)
- Johnson & Johnson (U.S.)
- AbbVie Inc. (U.S.)
- Gilead Sciences (U.S.)
- Celgene Corporation (U.S.)
- Eisai Co., Ltd. (Japan)
- Takeda Pharmaceutical Company Limited (Japan)
- Amgen Inc. (U.S.)
- Teva Pharmaceutical Industries Ltd. (Israel)
- Mylan N.V. (U.S.)
- Daiichi Sankyo Company, Limited (Japan)
- Otsuka Pharmaceutical Co., Ltd. (Japan)
- Ipsen (France)
Breast Cancer Therapeutics Market Report Segmentation
This report forecasts revenue growth at country levels and provides an analysis of the latest industry trends in each of the sub-segments from 2021 to 2033. For this study, Nova one advisor, Inc. has segmented the Breast Cancer Therapeutics market.
By Therapy
- Targeted Therapy
- Abemaciclib
- Ado-Trastuzumab Emtansine
- Everolimus
- Trastuzumab
- Ribociclib
- Pertuzumab
- Olaparib
- Others
- Hormonal therapy
- Selective estrogen receptor modulators
- Aromatase inhibitors
- Estrogen receptor downregulation
- Chemotherapy
- Immunotherapy
By Cancer Type
By Distribution Channel
- Hospital Pharmacies
- Retail Pharmacies
- Online Pharmacies
- Others
By Region
- North America
- Europe
- Asia-Pacific
- Latin America
- Middle East & Africa (MEA)


