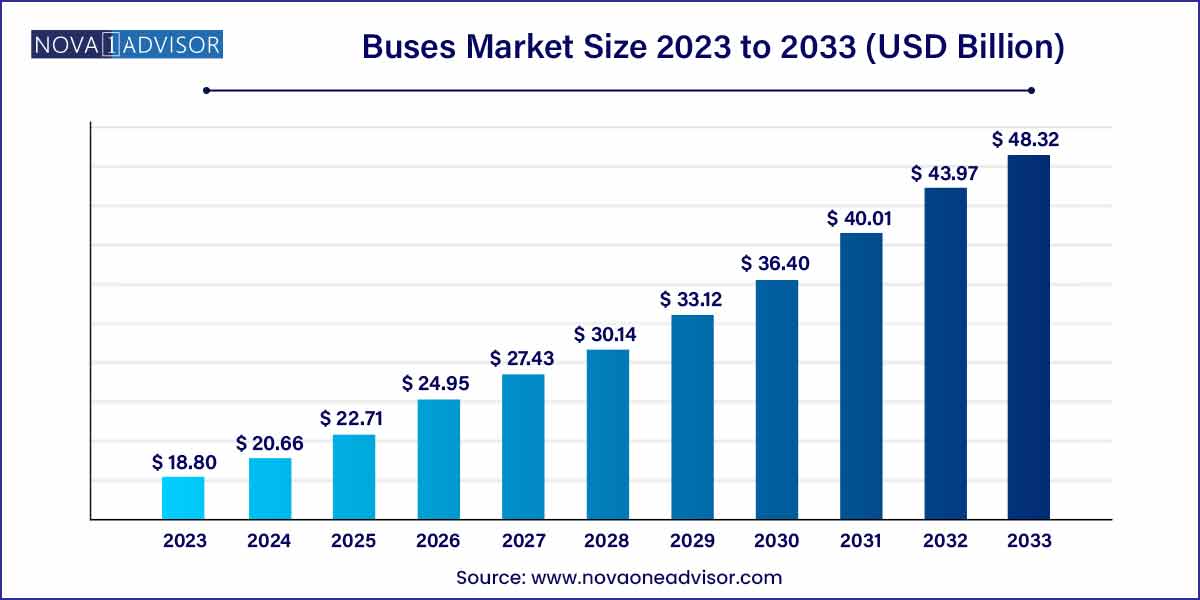
The global buses market size was exhibited at USD 18.80 billion in 2023 and is projected to hit around USD 48.32 billion by 2033, growing at a CAGR of 9.9% during the forecast period of 2024 to 2033.

Key Takeaways:
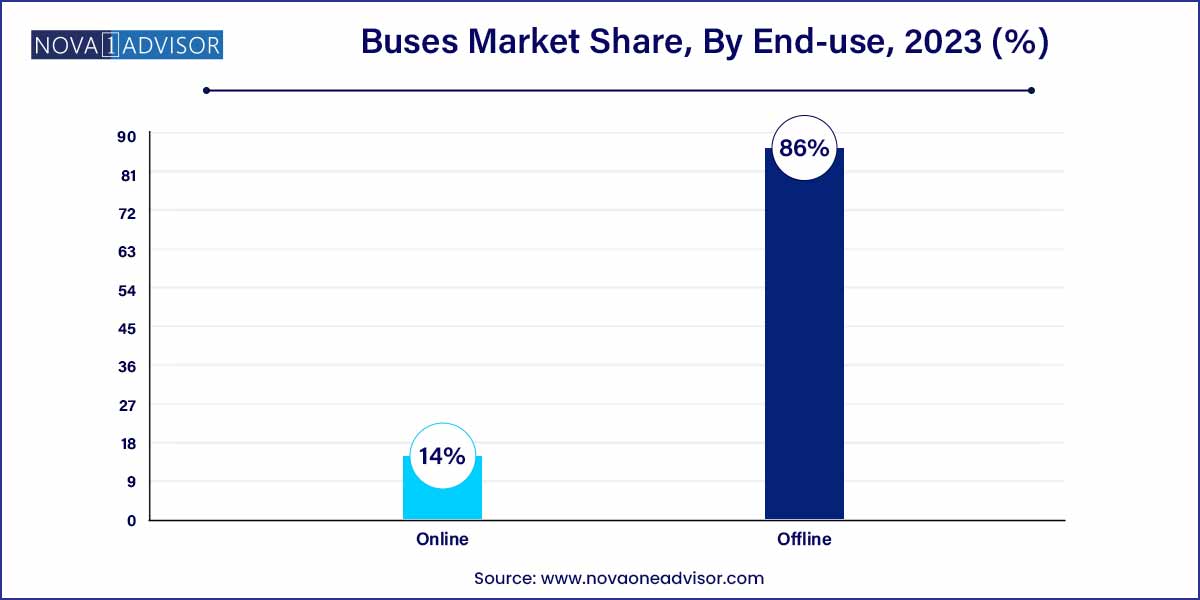
- On the basis of distribution channel, the offline channel held over 86% of the market revenue.
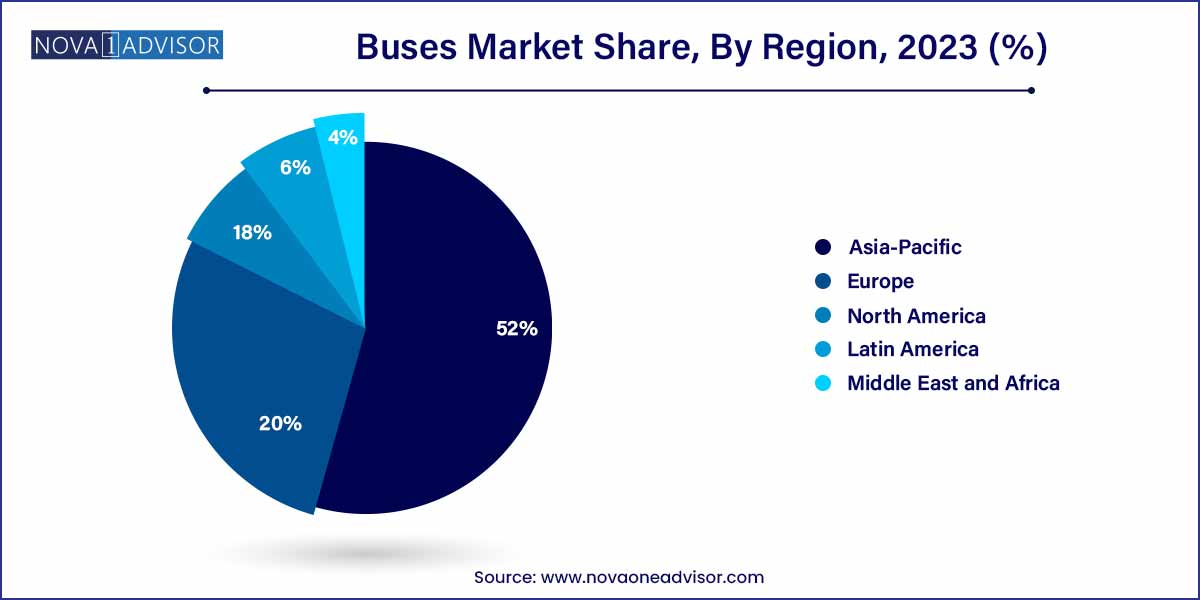
- Asia Pacific accounted for the largest market revenue share of more than 52% in 2023 and is expected to register strong growth during the forecast period.
Buses Market by Overview
The global buses market is an integral pillar of public transportation systems, facilitating the movement of millions across urban, suburban, and rural areas. From school transport to intra-city commutes and inter-city travel, buses play a vital role in enhancing mobility, reducing traffic congestion, and curbing carbon emissions. This sector spans a range of vehicle types including minibuses, city buses, school buses, intercity coaches, and increasingly, electric and hybrid buses. As urbanization accelerates and sustainability goals become central to policy-making, the relevance and evolution of the bus industry have come into sharp focus.
Governments, particularly in emerging economies, are significantly investing in expanding their public transport infrastructure, wherein buses are often prioritized due to cost-effectiveness and adaptability. This momentum is bolstered by increasing pressure on urban planners to reduce carbon emissions, minimize air pollution, and shift commuters away from private vehicles. With the rise in fuel prices and mounting environmental concerns, there is a growing emphasis on clean energy buses, including electric and hydrogen fuel cell models. Meanwhile, bus manufacturers are adopting advanced technologies such as real-time tracking, contactless fare systems, and enhanced safety features to make buses more appealing to modern commuters.
The COVID-19 pandemic initially disrupted the market, causing a decline in demand due to lockdowns and fear of public spaces. However, post-pandemic recovery has seen a rebound, driven by a combination of public health investments and renewed commitments to sustainable urban transport. The buses market is thus transitioning from traditional diesel-powered fleets to digitized, connected, and clean-energy mobility solutions.
Major Trends in the Market
-
Electrification of Public Transport Fleets: Massive investments in electric buses by municipalities, especially in China, India, and Europe.
-
Rise of Smart Mobility Solutions: Integration of GPS, telematics, contactless payments, and automated passenger counting systems.
-
Government Incentives and Emission Norms: Subsidies for electric buses and strict emission regulations accelerating fleet modernization.
-
Fleet-as-a-Service (FaaS) Models: Companies and governments increasingly shifting to leasing or subscription models for bus operations.
-
Autonomous Bus Trials: Pilot projects in countries like Sweden and Singapore for driverless shuttle buses.
-
Growth of School Bus Safety Standards: Increasing demand for enhanced safety systems such as collision avoidance and onboard monitoring.
-
Rural Connectivity Expansion: Government focus on extending bus routes to underdeveloped and rural areas to ensure last-mile connectivity.
-
Rise in Demand for Intercity Buses: Economic travel solutions continue to thrive, especially in large countries like the U.S., Brazil, and India.
Buses Market Report Scope
| Report Coverage |
Details |
| Market Size in 2024 |
USD 18.80 Billion |
| Market Size by 2033 |
USD 48.32 Billion |
| Growth Rate From 2024 to 2033 |
CAGR of 9.9% |
| Base Year |
2023 |
| Forecast Period |
2024-2033 |
| Segments Covered |
Distribution Channel, Region |
| Market Analysis (Terms Used) |
Value (US$ Million/Billion) or (Volume/Units) |
| Regional Scope |
North America; Europe; Asia Pacific; Central and South America; the Middle East and Africa |
| Key Companies Profiled |
FirstGroup plc.; National Express Group plc.; Stagecoach Group plc.; Transdev; Central Japan Railway Company; Group Keolis SAS; RegioJet A.S.; MTR Corporation Limited; Go Ahead Group plc. |
Buses Market Dynamics
The buses market dynamics are significantly influenced by the ongoing trend towards electrification and sustainable transportation solutions. As environmental concerns intensify, there is a growing demand for electric buses, driven by stringent emission standards and a global commitment to reducing the carbon footprint. This shift is fostering innovation among manufacturers, leading to the development of advanced electric bus models. Moreover, government initiatives and incentives aimed at promoting eco-friendly public transportation are acting as catalysts for market growth.
Technological advancements play a pivotal role in shaping the dynamics of the buses market. The integration of advanced technologies, such as telematics, GPS tracking, and connectivity solutions, is revolutionizing the efficiency, safety, and overall performance of buses. Telematics, for instance, enables real-time monitoring of vehicle conditions, preventive maintenance, and route optimization, contributing to operational cost savings for fleet operators. Additionally, the exploration of autonomous or semi-autonomous buses is opening new avenues for enhanced safety and efficiency in public transportation.
Buses Market Restraint
High initial costs associated with the adoption of advanced and environmentally friendly buses pose a significant restraint to the buses market. Electric buses, in particular, often come with a higher upfront price compared to traditional diesel counterparts. This financial barrier can deter some transit authorities and fleet operators from investing in greener technologies, despite the potential long-term cost savings through reduced fuel and maintenance expenses.
Infrastructure challenges represent a notable restraint for the buses market, particularly concerning the adoption of electric buses. The successful implementation of electric bus fleets requires a robust charging infrastructure, including charging stations and supportive grid systems. Insufficient infrastructure can hinder the widespread adoption of electric buses, limiting their operational range and increasing concerns about charging accessibility. Addressing this restraint demands collaborative efforts between governments, local authorities, and private entities to invest in and develop the necessary infrastructure, creating an environment conducive to the broader deployment of electric buses in various regions.
Buses Market Opportunity
The burgeoning demand for sustainable and electric transportation solutions presents a compelling opportunity within the buses market. As environmental consciousness grows globally, there is an increasing shift towards eco-friendly alternatives, with electric buses gaining prominence. This presents an opportunity for manufacturers to capitalize on the rising demand for electric buses and leverage advancements in battery technology to enhance the range, efficiency, and affordability of electric bus models. Strategic partnerships, innovative financing models, and government incentives can further accelerate the adoption of electric buses, providing a substantial growth opportunity for businesses in the market.
The integration of smart and connected technologies offers a significant opportunity for advancement within the buses market. With the increasing emphasis on smart cities and digital transformation, buses equipped with advanced connectivity features, such as real-time tracking, passenger information systems, and integrated payment solutions, can enhance the overall passenger experience and operational efficiency. This presents an opportunity for manufacturers to invest in research and development, creating technologically advanced buses that align with the evolving needs of transit authorities and passengers. The deployment of such connected solutions not only improves service quality but also opens new revenue streams and establishes a competitive edge in the dynamic buses market.
Buses Market Challenges
High initial costs associated with the adoption of advanced technologies, such as electric propulsion systems, pose a substantial challenge in the buses market. Electric buses, while environmentally friendly, often come with a higher upfront price compared to traditional diesel or compressed natural gas (CNG) counterparts. This financial barrier can deter cash-strapped transit authorities and fleet operators from embracing more sustainable options, creating a challenge for manufacturers to address cost concerns through innovations, economies of scale, and collaborative efforts with stakeholders to make environmentally friendly buses more economically viable.
Insufficient charging infrastructure represents a critical challenge, especially for the widespread adoption of electric buses. The successful integration of electric bus fleets relies heavily on a well-established and easily accessible charging infrastructure. The lack of charging stations, both in terms of quantity and distribution, limits the operational range and flexibility of electric buses. Overcoming this challenge requires substantial investments in charging infrastructure, with cooperation between governments, local authorities, and private entities to create a comprehensive network that supports the deployment of electric buses on a broader scale.
Segments Insights:
Distribution Channel Insights
On the basis of distribution channel, the offline channel held over 86% of the market revenue share and is expected to maintain its dominance with a projected CAGR of 9.3% during the forecast period. The growth is significantly attributed to the higher consumer preference for the traditional booking systems in the countries in the Asia Pacific and other emerging countries. Also, the majority of the service providers of intercity bus travel offer ticket booking via an offline channel. The lack of widespread access to cutting-edge distribution technology for the consumers as well as the bus fleet owners is resulting in a higher market revenue share of the offline channel.

Online segment of distribution channel is projected to register a CAGR of 11.9% from 2023 to 2033 and is expected to witness robust growth over the forecast period. The growth of the segment is significantly credited to the technological advancement in the bus market and booking app technology. Additionally, the expansion of the key players providing online services in the new emerging markets is expected to increase consumer accessibility. This is ultimately anticipated to drive the online segment growth over the forecast period. For instance, GoGoBus, a startup based in India serving since January 2020, has built a TaaS platform. The platform will help streamline intercity bus travel from demand visibility to seat bookings.
Regional Insights
North America dominated the small SUVs market, accounting for the highest market share in recent years. The region benefits from a mature automotive infrastructure, high disposable incomes, and a strong consumer preference for SUVs over sedans. U.S. automakers like Ford and General Motors have heavily invested in this segment, with models such as the Ford Escape and Chevrolet Trax seeing widespread adoption. Consumer interest in safety, comfort, and in-car entertainment systems further aligns with the tech-integrated nature of modern small SUVs. Additionally, North American buyers appreciate the balance between affordability and utility, especially in suburban and semi-urban areas where small SUVs are replacing sedans as the preferred family car.

Conversely, Asia-Pacific is the fastest-growing regional market, buoyed by economic growth, expanding middle-class populations, and urbanization. Countries like China, India, and Indonesia are witnessing a surge in demand for compact yet versatile vehicles. Global and local automakers are responding by launching region-specific models tailored to local road conditions and consumer preferences. For example, in early 2025, Tata Motors announced plans to expand its Nexon EV line to Southeast Asian markets, emphasizing affordability and local manufacturing. With infrastructural development, rising environmental consciousness, and the rise of first-time buyers, Asia-Pacific is expected to outpace other regions in CAGR terms over the next decade.
Some of the prominent players in the buses market include:
- FirstGroup plc.
- National Express Group plc.
- Stagecoach Group plc.
- Transdev
- Central Japan Railway Company
- Group Keolis SAS
- RegioJet A.S.
- MTR Corporation Limited
- Go Ahead Group p
Segments Covered in the Report
This report forecasts revenue growth at global, regional, and country levels and provides an analysis of the latest industry trends in each of the sub-segments from 2021 to 2033. For this study, Nova one advisor, Inc. has segmented the global buses Market.
Distribution Channel
By Region
- North America
- Europe
- Asia-Pacific
- Latin America
- Middle East & Africa (MEA)


