Cell and Gene Therapy CDMO Market Size and Forecast 2026 to 2035
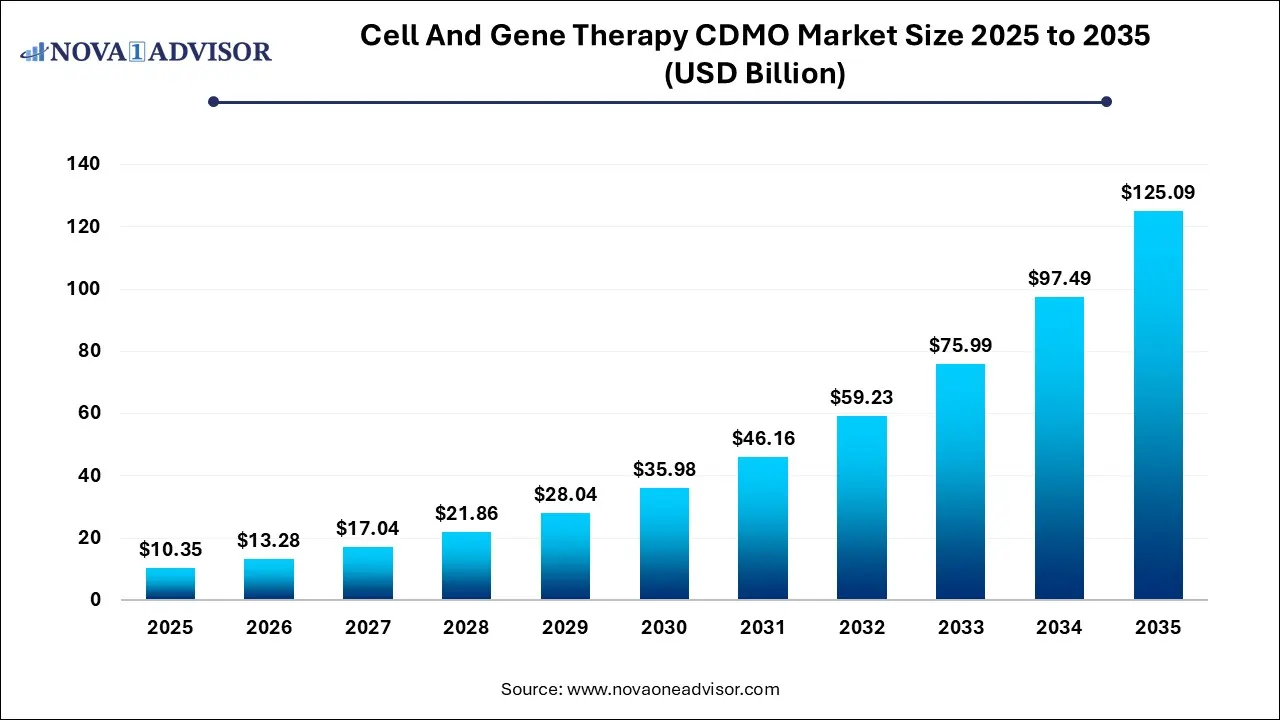
The global cell and gene therapy CDMO market size was estimated at USD 10.35 billion in 2025 and is projected to hit around USD 125.09 billion by 2035, growing at a CAGR of 28.3% during the forecast period from 2026 to 2035. The cell and gene therapy CDMO market growth is driven by the rising demand for outsourced services, focus on addressing unmet needs, advancements in manufacturing technologies, and increased R&D expenditure.

Key Takeaways:
- North America accounts for the largest share of 41% in 2025.
- Asia Pacific, on the other hand, is anticipated to register a lucrative CAGR of 29.1% during the forecast period.
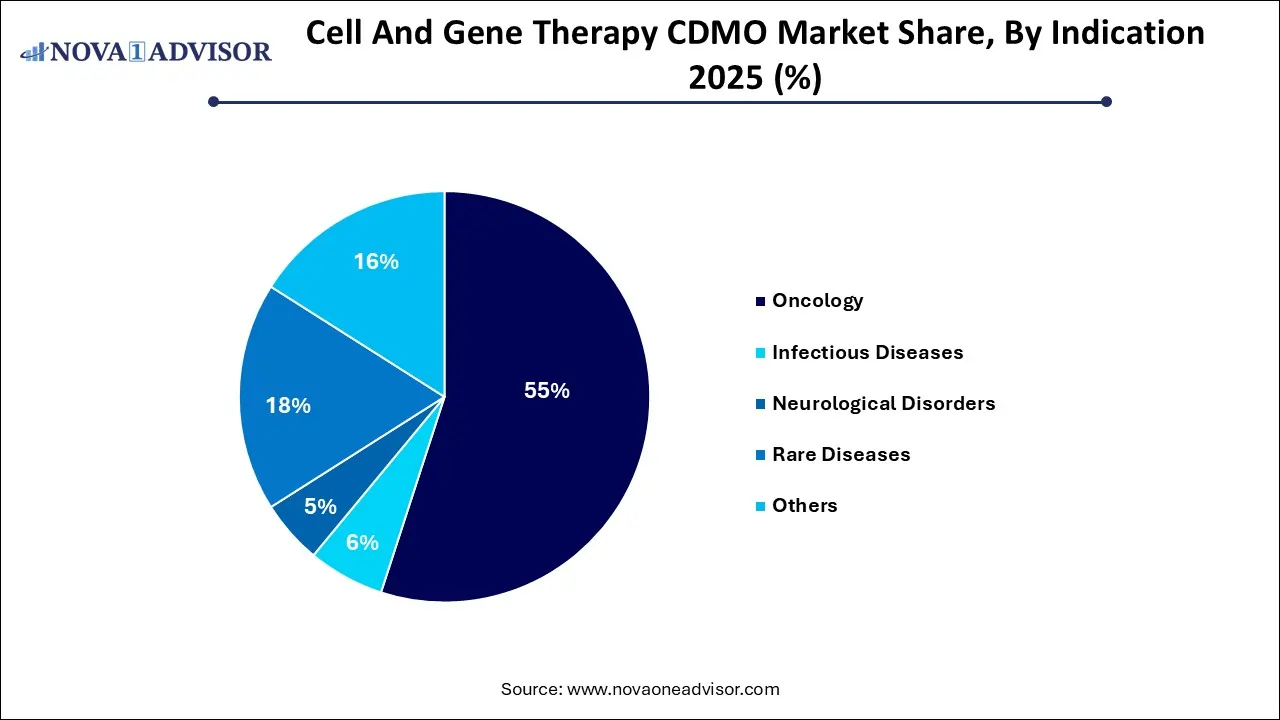
- The oncology segment dominated the cell and gene therapy CDMO market and held the largest revenue share of 50.0% in 2025.
- On the other hand, the rare diseases segment is anticipated to witness a lucrative CAGR of 28.5% during the forecast
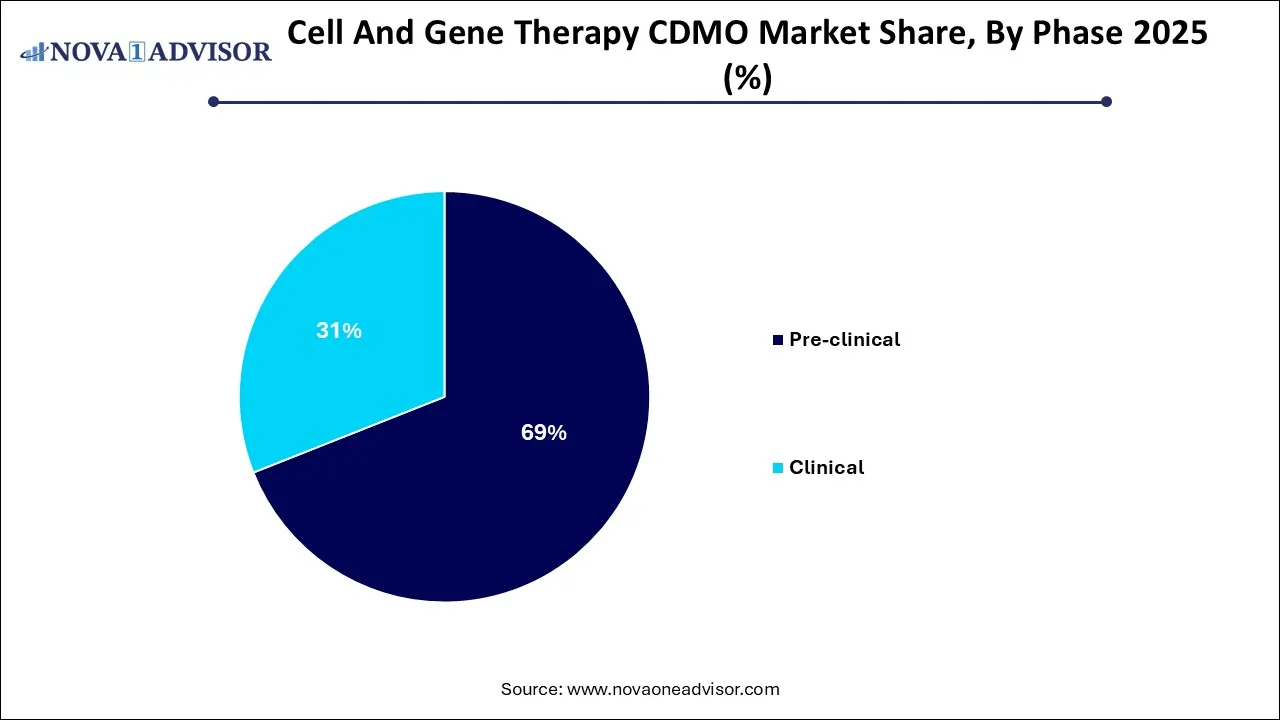
- The pre-clinical segment held the largest revenue share of 69% in 2025
- The clinical segment is anticipated to witness a considerable CAGR of 27.15% during the analysis period.
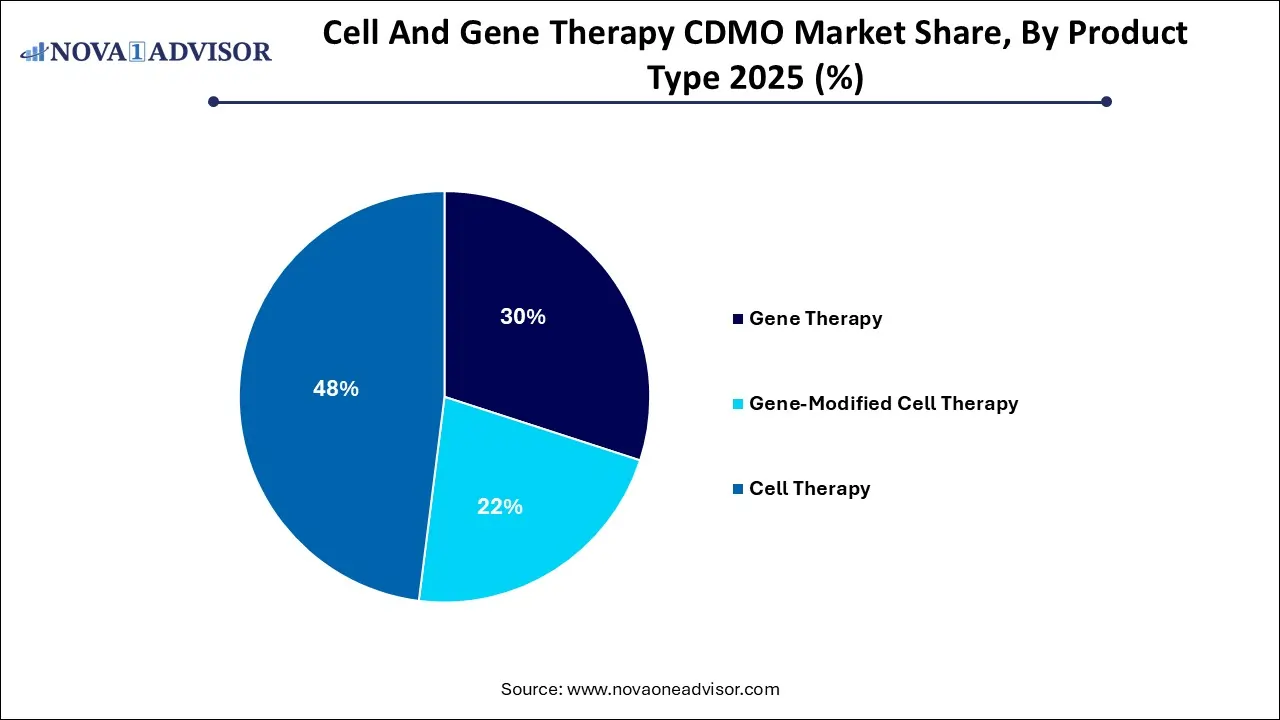
- The cell therapy segment dominated the market and held the largest revenue share of 48% in 2025.
- The gene-modified cell therapy segment, on the other hand, is anticipated to witness a lucrative CAGR of 28.9% during the analysis period.
Market Overview
The cell and gene therapy CDMO market (Contract Development and Manufacturing Organization) market has become an essential and dynamic component of the biopharmaceutical industry, driven by the explosive growth in demand for personalized, regenerative, and precision medicine. Contract manufacturers serve as vital enablers for biotech firms by offering a range of services including process development, scale-up, analytical testing, GMP manufacturing, and regulatory support. As cell and gene therapies (CGTs) progress from clinical to commercial stages, the complexities involved in their development and manufacturing necessitate a specialized, compliant, and scalable infrastructure precisely the capabilities that CDMOs are equipped to provide.
Unlike traditional pharmaceuticals, CGTs involve highly sensitive biological materials that require bespoke handling, cold chain logistics, and contamination-free environments. CDMOs not only bridge this gap for emerging biotechs lacking the capital to build in-house facilities but also allow large pharmaceutical companies to maintain agile, decentralized supply chains. As of 2024, the market has shown strong momentum, buoyed by an increasing number of clinical trials, favorable regulatory initiatives, and high-profile therapy approvals like Luxturna and Zolgensma. Major pharmaceutical players are forging strategic partnerships or acquiring CDMOs to internalize capabilities and reduce time-to-market.
As investment in CGT R&D continues to soar and more therapies enter late-stage trials, the global CDMO landscape is rapidly evolving, characterized by technological innovation, geographical expansion, and an arms race for production capacity.
Major Trends in the Market
-
Integration of AI and automation technologies for improving process efficiency and predictive quality control.
-
Surging demand for viral vector production, especially AAV and lentivirus, due to the growing number of gene therapies.
-
Rise of modular and flexible manufacturing facilities that allow CDMOs to adapt quickly to diverse client needs.
-
Increased outsourcing by biotechs owing to capital constraints and focus on core competencies.
-
Mergers and acquisitions involving large pharmaceutical companies and niche CDMOs.
-
Adoption of single-use bioreactors and closed-system processing to minimize contamination and streamline operations.
-
Expansion into emerging markets to reduce manufacturing costs and support clinical trials in Asia-Pacific and Latin America.
-
Capacity expansion initiatives led by CDMOs to cater to the commercial-scale production of late-stage therapies.
What is the role of Artificial Intelligence in Cell and Gene Therapy CDMO Market:
AI-driven tools optimize key bioprocessing steps like media formulation, cell culture, and viral vector yields. Real-time monitoring using sensors and machine learning enables detecting deviations early and predicting batch performance, reducing failure rates and shortening time‑to‑market.
Machine learning models analyze production data to identify anomalies and predict potential failures. Combined with automation, AI supports Quality by Design approaches, increasing consistency and lowering regulatory risk.
Natural language processing (NLP) and predictive analytics help sponsors evaluate CDMOs more efficiently, mining inspection reports, compliance data, and facility capabilities to generate smarter risk and performance assessments.
Cell And Gene Therapy CDMO Market Report Scope
| Report Attribute |
Details |
| Market Size in 2026 |
USD 13.28 Billion |
| Market Size by 2035 |
USD 125.09 Billion |
| Growth Rate From 2026 to 2035 |
CAGR of 28.3% |
| Base Year |
2025 |
| Forecast Period |
2026 to 2035 |
| Segments Covered |
Phase, Product Type, Indication, Region |
| Market Analysis (Terms Used) |
Value (US$ Million/Billion) or (Volume/Units) |
| Report Coverage |
Revenue forecast, company ranking, competitive landscape, growth factors, and trends |
| Key Companies Profiled |
Lonza; Catalent, Inc; Cytiva; Samsung Biologics; Thermo Fisher Scientific Inc.; Novartis AG; WuXi AppTec; AGC Biologics; OmniaBio; Rentschler Biopharma SE; Charles River Laboratories |
Key Market Driver: Rising Clinical Pipeline for Cell and Gene Therapies
One of the most significant drivers for the Cell and Gene Therapy CDMO market is the ever-growing clinical pipeline of advanced therapies. With over 2,000 cell and gene therapy candidates in various stages of development worldwide, CDMOs are increasingly seen as indispensable partners in bridging the gap between scientific discovery and market delivery. This spike in clinical activity is not only restricted to major pharmaceutical players but also includes a surge in emerging biotechs, particularly those focused on rare diseases and oncology. The increasing number of Phase I and II trials has fueled demand for pre-clinical and clinical manufacturing services, including vector production, fill-finish operations, and process development. CDMOs equipped with GMP-compliant facilities and regulatory expertise offer biotech firms the agility and scalability required to manage the complexity of early-stage development and accelerate their timelines to commercialization.
Key Market Restraint: Limited Viral Vector Manufacturing Capacity
Despite the promising growth, one of the most pressing restraints in the market is the global shortage of viral vector manufacturing capacity. Viral vectors such as adeno-associated viruses (AAV) and lentiviruses are critical components for gene delivery in most in-vivo and ex-vivo therapies. However, their production is technically complex, requires specialized equipment, and must meet stringent quality standards. This bottleneck is further exacerbated by limited global manufacturing infrastructure, long lead times, and high batch-to-batch variability. The scarcity of skilled workforce trained in viral vector bioprocessing adds to the challenges. These capacity constraints can delay clinical timelines, increase development costs, and pose risks to therapy accessibility, especially for smaller biotechs without privileged access to CDMO partnerships.
Key Market Opportunity: Expansion of Commercial Manufacturing Services
The commercial landscape for CGTs is evolving rapidly, creating a strong opportunity for CDMOs to expand their commercial manufacturing services. As more therapies receive FDA and EMA approvals, the need to transition from small-scale clinical manufacturing to large-scale commercial production becomes paramount. CDMOs that can offer integrated, end-to-end solutions ranging from process development to commercial supply, regulatory submissions, and logistics are becoming preferred partners. Companies like Lonza, Catalent, and Thermo Fisher Scientific are making strategic investments in commercial-scale facilities and digital infrastructure to support the shift. Moreover, CDMOs that can deliver flexible batch sizes, real-time data monitoring, and faster turnaround times will be well-positioned to capitalize on the burgeoning market.
Segmental Analysis
Why Did the Pre-Clinical Segment Dominate the Market in 2025?
By phase, the pre-clinical segment dominated the market with the highest revenue share in 2025. Pre-clinical studies are crucial for evaluating the efficacy and safety of new cell and gene therapy (CGT) treatments before conducting human trials. These studies provide necessary data required for advancing clinical trials as well as reduce the costs and timelines associated with development of innovative therapies. The expanding pipeline of CGT products in the preclinical phase, increasing investments in R&D activities, and complex regulatory pathways and need for specialized expertise are the factors driving the market growth of this segment.

CDMOs offer services such as cell line and vector characterization, in vitro and in vivo testing, toxicology studies, regulatory support as well as manufacturing expertise in areas like cell transfection and viral vector generation through their advanced facilities and state-of-the-art technologies. Companies as well as academic institutions are partnering with CDMOs to access these resources without making any upfront capital expenditure, further expanding the market potential.
By phase, the clinical segment is expected to register the fastest growth over the forecast period. The increasing number of cell and gene therapy clinical trials for various diseases and disorders, particularly in Phase I and Phase II stage is creating high demand for CDMO services to supporting the development and manufacturing of these therapies. Rising influx of capital by both public and private sectors in cell and gene therapy research and development is contributing to the market growth. Targeted approach on specific diseases such as rare disorders and oncology is boosting the adoption of specialized CDMO services by biopharmaceutical companies, academic institutions and research organizations.
Cell and Gene Therapy CDMO Market, By Phase, 2022-2025 (%)
| By Phase |
2022 |
2023 |
2024 |
2025 |
| Pre-clinical |
70.50% |
69.97% |
69.44% |
68.90% |
| Clinical |
29.50% |
30.03% |
30.56% |
31.10% |
| Total |
100.00% |
100.00% |
100.00% |
100.00% |
What Drives the Dominance of Gene Therapy Segment in Market in 2026?
By product type, the gene therapy segment accounted for the largest market share in 2025. Rising incidences of chronic illnesses and genetic disorders, advanced gene editing technologies like CRISPR-Cas9 and non-viral gene therapy delivery methods, ongoing clinical trials for gene therapies at various sites worldwide and demand for personalized therapies are contributing to the market dominance of this segment. Development of gene therapies require specialized manufacturing processes such as complex bioprocessing, product of viral vectors and stringent quality control measures. CDMOs offer end-to-end services to support these complex manufacturing and development processes as well as provide commercialization assistance.

- For instance, in June 2025, ProBio, an international CDMO specializing in cell and gene therapy, launched its flagship Cell and Gene Therapy Center of Excellence at the Princeton West Innovation Campus in Hopewell, New Jersey. The GMP compliant facility is designed specifically to manufacture high-quality plasmid DNA and viral vectors, including adeno-associated virus (AAV) and lentiviral vector (LVV) platforms.
By product type, the gene-modified cell therapy segment is anticipated to witness the fastest growth during the predicted timeframe. The increasing complexity of cell therapies as well as significant investments in R&D operations by drug developers is driving the demand for specialized CDMO services such as viral vector production, cell line development, and analytical testing. Advancing healthcare infrastructure in emerging economies, need for specialized manufacturing processes, focus on rare diseases, surge in clinical trials, innovative technologies and accelerated regulatory approvals are the factors driving the market expansion. Strategic partnerships, expansion of service offerings, and focus on extending geographical reach by CDMOs is creating opportunities for market growth.
Cell and Gene Therapy CDMO Market, By Product Type, 2022-2025 (%)
| By Product Type |
2022 |
2023 |
2024 |
2025 |
| Gene Therapy |
29.37% |
29.54% |
29.71% |
29.88% |
| Ex-vivo |
31.23% |
48.31% |
48.23% |
48.16% |
| In-vivo |
68.77% |
51.69% |
51.77% |
51.84% |
| Gene-Modified Cell Therapy |
22.21% |
22.53% |
22.85% |
23.17% |
| CAR T-cell Therapies |
65.89% |
65.60% |
65.30% |
65.01% |
| CAR-NK Cell Therapy |
10.01% |
10.15% |
10.30% |
10.44% |
| TCR-T Cell Therapy |
6.12% |
6.17% |
6.22% |
6.27% |
| Other |
17.98% |
18.08% |
18.18% |
18.28% |
| Cell Therapy |
48.42% |
47.93% |
47.44% |
46.95% |
| Total |
100.00% |
100.00% |
100.00% |
100.00% |
How Oncology Segment Dominated the Market in 2025?
By indication, the oncology segment captured the largest market share in 2025. According to the Global Cancer Statistics, 2024 released by the American Cancer Society (ACS) in April, 2024, approximately 20 million cancer cases were freshly diagnosed and about 9.7 million people died from the disease worldwide in 2022. Increased emphasis on development of novel cell and gene therapy products, especially for solid tumors and haematological malignancies is driving the demand for CDMO services. Furthermore, the rising trend of outsourcing complex manufacturing processes, rigorous regulatory scrutiny, success of CAR-T cell therapies, and rising investments in R&D for supporting clinical trials and commercialization are driving the market dominance of this segment.

By indication, the rare diseases segment is expected to show the fastest growth during the forecast period. The market growth can be attributed to the increasing number of clinical trials targeting rare diseases, lack of effective treatments, rising demand for specialized therapies, and significant investments by drug developers are contributing to the market growth. Advancements in rare disease treatment such as gene editing technologies like CRISPR-Cas9, delivery of therapeutic genes through novel nucleic acid formats, regenerative medicine approaches such as stem cell therapy with induced pluripotent stem cells (iPSCs), viral vectors and LNP-encapsulated mRNA are expanding the market potential.
For instance, in July 2025, Elly’s Team, a parent-led foundation focused on finding a cure for a rare genetic disorder, Neurodevelopmental Disorder with Regression, Abnormal Movements, Loss of Speech, and Seizures (NEDAMSS), have declared a plasmid DNA contract development and manufacturing organization (CDMO) agreement with Charles River Laboratories International, Inc. By leveraging Charles River’s Cell and Gene Therapy (CGT) Accelerator Program (CAP), Elly’s Team will gain access to established gene therapy CDMO capabilities and advisory services for manufacturing critical starting materials required for a Phase I clinical trial.
Cell and Gene Therapy CDMO Market, By Indication, 2022-2025 (%)
| By Indication |
2022 |
2023 |
2024 |
2025 |
| Oncology |
54.89% |
54.60% |
54.31% |
54.01% |
| Infectious Diseases |
7.12% |
7.12% |
7.12% |
7.11% |
| Neurological Disorders |
5.34% |
5.41% |
5.48% |
5.55% |
| Rare Diseases |
16.23% |
16.62% |
17.02% |
17.41% |
| Others |
16.42% |
16.25% |
16.09% |
15.92% |
| Total |
100.00% |
100.00% |
100.00% |
100.00% |
| |
100.00% |
100.00% |
100.00% |
100.00% |
Regional Analysis
North America dominates the Cell and Gene Therapy CDMO market, primarily led by the United States, which is home to the highest number of CGT clinical trials, a mature regulatory framework, and a high concentration of CDMOs. States like Massachusetts, California, and North Carolina are hubs for advanced therapy manufacturing, supported by proximity to academic institutions and biotech clusters. The FDA’s progressive stance and funding initiatives like the NIH's support for gene therapy trials have created a favorable environment. Leading CDMOs headquartered in North America, such as Catalent, Thermo Fisher, and Resilience, continue to expand capacity to meet domestic and international demand.
United States:
- Leading biotechnology firms like Amgen are using AI, from drug design to automated manufacturing controls via platforms like AWS SageMaker.
- Deployments like Cellares’ Cell Shuttle are redefining robotic AI‑enabled autologous cell therapy production, anchored in South San Francisco.
- CDMOs are adopting cloud-based and AI‑powered manufacturing systems for predictive scheduling, digital twins, process monitoring, and regulatory-ready data capture
Asia-Pacific is the fastest-growing region, fueled by increasing government investment in biotech infrastructure, a rising number of clinical trials, and growing outsourcing from Western pharma companies. Countries like China, South Korea, and Japan are aggressively investing in CGT capabilities, offering cost-effective solutions and regulatory streamlining. Chinese CDMOs such as WuXi AppTec have expanded internationally and are now key players in the global market. Moreover, favorable regulatory reforms and growing local demand for CGTs are expected to bolster APAC’s position further.
India:
- India’s large CRAMS/CDMO industry is expanding into biologics and CGT, supported by local players (e.g., Dr. Reddy’s, Piramal/Yapan Bio, Syngene) and WHO‑GMP facilities.
- At a Indian pharma-industry conference (Feb 2025), companies including Amgen and Parexel highlighted use of AI to speed drug-trial safety reporting, molecule discovery and image analysis, pointing to a growing AI-enabled ecosystem in India.
- Indian research institutions like inStem (Bengaluru) are focusing on stem cell biology and regenerative medicine; though not directly a CDMO, such R&D centers drive innovation that can later flow into CDMO deployment.
Cell and Gene Therapy CDMO Market, By Region, 2022-2025 (%)
| By Region |
2022 |
2023 |
2024 |
2025 |
| North America |
52.07% |
51.96% |
51.86% |
51.75% |
| Europe |
26.18% |
26.02% |
25.85% |
25.69% |
| Asia Pacific |
18.02% |
18.34% |
18.66% |
18.98% |
| Latin America |
2.50% |
2.47% |
2.44% |
2.41% |
| Middle East & Africa |
1.23% |
1.21% |
1.19% |
1.17% |
| Total |
100.00% |
100.00% |
100.00% |
100.00% |
Key Cell And Gene Therapy CDMO Companies:
- Lonza
- Catalent, Inc
- Cytiva
- Samsung Biologics
- Thermo Fisher Scientific Inc.
- Novartis AG
- WuXi AppTec
- AGC Biologics
- OmniaBio
- Rentschler Biopharma SE
- Charles River Laboratories
Recent Developments
- In June 2025, uBriGene Biosciences, introduced its completely characterized, ready-to-use induced pluripotent stem cell (iPSC) banks which are developed by leveraging uBriGene's proprietary RNA-LNP reprogramming technology.
- In June 2025, EVA Pharma, a leading pharmaceutical company focused on driving healthcare innovation and access across the Middle East and Africa, signed a Memorandum of Understanding (MoU) with Porton Advanced Solutions, a global leading cell and gene therapy CDMO service provider. The collaboration focuses on establishing and bolstering CAR T-cell therapy development and manufacturing capabilities at EVA Pharma’s facilities.
- In April 2025, AGC Biologics, declared the formation of a new Cell and Gene Technologies Division developed for addressing and elevating AGC Biologics capabilities and further enhance the company’s performance as a trustworthy, experienced and friendly advanced therapy CDMO globally.
- In October 2024, OmniaBio, launched a new manufacturing facility designed to meet the specialized requirements of cold chain logistics, and production of cell and gene therapies by utilizing artificial intelligence (AI).
Segments Covered in the Report
This report forecasts revenue growth at country levels and provides an analysis of the latest industry trends in each of the sub-segments from 2021 to 2035. For this study, Nova one advisor, Inc. has segmented the Cell And Gene Therapy CDMO market.
By Phase
By Product Type
- Gene Therapy
- Gene-Modified Cell Therapy
- CAR T-cell Therapies
- CAR-NK Cell Therapy
- TCR-T Cell Therapy
- Other
- Cell Therapy
By Indication
- Oncology
- Infectious Diseases
- Neurological Disorders
- Rare Diseases
- Others
By Region
- North America
- Europe
- Asia-Pacific
- Latin America
- Middle East & Africa (MEA)


