Electric Vehicle Market (By Propulsion: BEV, PHEV, ECEV; By Components: Battery Cells & Packs, On-Board Charge, Motor, Reducer, Others; By Vehicle Type: Passenger Cars Commercial Vehicles; By Vehicle Class: Mid-priced, Luxury; By Top Speed: Less Than 100 MPH, 100 to 125 MPH, More Than 125 MPH; By Vehicle Drive; By EV Charging Point Type; By V2G; By Propulsion Type)- Global Industry Analysis, Share, Growth, Regional Outlook and Forecasts, 2023-2032

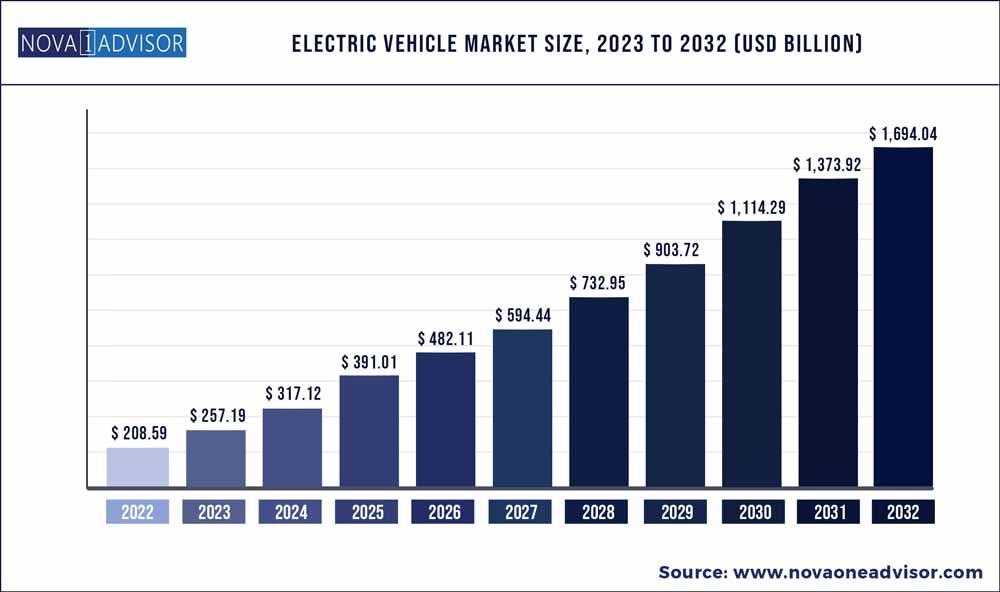
The global electric vehicle market size was exhibited at USD 208.59 billion in 2022 and is projected to hit around USD 1,694.04 billion by 2032, growing at a CAGR of 23.3% during the forecast period 2023 to 2032.

electric vehicle market size

Key Pointers:

  • By 2040, the Europe is expected to achieve 41% greenhouse gas reduction and net-zero by 2050.
  • EV sales increased by 80% in the United States in 2019.
  • Asia Pacific electric vehicle market was valued at USD 123.9 billion in 2022.
  • By propulsion type, the battery electric vehicles (BEV) accounted largest revenue share 67.7% in 2022.
  • By vehicle type, the passenger car segment has accounted 62.4% revenue share in 2022.
  • By propulsion type, battery electric vehicles segment has generated 67.9% revenue share in 2022.
  • By vehicle class, the mid-priced segment has held revenue share of 74.4% in 2022.
  • Asia Pacific has dominated the market with 42.4% revenue share in 2022.
  • The hybrid electric vehicle segment is expected to reach USD 319.67 billion by 2032 from valued at USD 79,581.7 million in 2022.
  • The plug-in hybrid EV segment is expected to hit revenue USD 485,617 million from 2023 to 2032.
  • The passenger car electric vehicle market was valued at USD 217,394 million in 2022 and is projected to hit at USD 698,735 million by 2032. 
  • The commercial vehicle EV market was valued at USD 47,451.9 million in 2022.
  • The luxury EV market is projecte to reach USD 541,273 million by 2032 from valued at USD 106,380 million in 2022.

COVID-19 Impact on the Electric Vehicle Market:

There was a moderate impact on the EV charging business due to the pandemic in early 2020 due to lockdowns. Due to the growing demand for EV market during the pandemic due to incentives from governments worldwide, the demand for EV charging stations increased in 2021. However, the outbreak of the COVID-19 pandemic had affected the extraction of materials such as steel, copper, and aluminum. The prices of raw materials such as copper continued to rise, with the copper price hitting USD 10,000 per ton for the first time in 10 years, in May 2021. On the other hand, top EV manufacturers have increased their EV sales rapidly over the past 2 years. Tesla for instance laid off employees in October 2020 due to deteriorating sales. However, its overall revenue increased due to its earlier expansion to China. In 2021, the company fared well and did not have much impact due to COVID-19. In early 2022, its sales again declined due to lockdowns in China. With the strong push from governments around the world to phase out ICE vehicles, this EV market was less impacted during the pandemic. 

Electric Vehicle Market Report Scope

Report Coverage

Details

Market Size in 2023

USD 257.19 Billion

Market Size by 2032

USD 1,694.04 Billion

Growth Rate from 2023 to 2032

CAGR of 23.3%

Base year

2022

Forecast period

2023 to 2032

Segments covered

Propulsion Type, Components, Vehicle Type, Vehicle Class, Top Speed, Vehicle Drive, EV Charging Point Type, V2G, Region

Regional scope

North America; Europe; Asia Pacific; Central and South America; the Middle East and Africa

Key companies profiled

BYD Company Ltd.,  Ford Motor Company , Daimler AG , General Motors Company, Mitsubishi Motor Corporation and  Groupe Renault


Factors such as growing demand for low emission commuting and governments supporting long range, zero emission vehicles through subsidies & tax rebates have compelled the manufacturers to provide electric vehicles around the world. This has led to a growing demand for electric vehicles in the market. Countries around the world have set up targets for emission reductions according to their own capacity.

Increasing investments by governments across the globe to develop EV charging stations and Hydrogen fueling stations along with incentives offered to buyers will create opportunities for OEMs to expand their revenue stream and geographical presence. The EV sector across Asia Pacific is projected to experience steady growth owing to the high demand for lower cost efficient and low-emission vehicles, while the North American and European market are fast growing markets due to the government initiatives and growing high-performance Passenger vehicle segment. However, relatively less number of EV charging stations and hydrogen fuel stations, higher costs involved in initial investments, and performance constraints could hamper the growth of global electric vehicle market.

Dynamics for Electric Vehicle Market / EV Market:

Driver: Reducing cost of EV batteries to support demand for cost-effective EVs

EV Market: The cost of EV batteries has been decreasing during the past decade due to technological advancements and the production of EV batteries on a mass scale in large volumes. This has led to a decrease in the cost of electric vehicles as EV batteries are one of the most expensive components of the vehicle. In 2010, the price of an EV battery was approximately USD 1,100 per kWh. However, by 2020, the price fell to approximately USD 137 per kWh, and it reached as low as USD 120 per kWh in 2021. The price of these batteries are as low as USD 100 per kWh in China’s electric vehicle industry. This is because of the reducing manufacturing costs of these batteries, reduced cathode material prices, higher production, etc. The prices of EV batteries are expected to fall to approximately USD 60 per kWh by 2030, which is expected to significantly reduce the prices of EVs, making them cheaper than conventional ICE vehicles.

Restraint: Insufficient EV charging infrastructure

There are a low number of EV charging stations in various countries around the world. This leads to the lower availability of public EV charging for electric vehicles, thus reducing adoption. Although various countries are in the process of installing EV charging infrastructure, most countries have not been able to install the required number of EV charging stations except in some states. The demand for EVs is expected to increase with a well-developed EV charging network across the world. Most countries are yet to develop such charging networks. The Netherlands has the highest EV charger density per 100 Km. The Netherlands has the highest density of around 19-20 charging stations per 100 km. China is the next best, with around 3-4 charging stations per 100 km. The UK has around 3 charging points per 100 km, but the country is rapidly expanding its charging stations with its 2030 plans to phase out sales of ICE vehicles. Germany, UAE, Japan, Singapore, South Korea, Sweden, France, US, and Russia have also stepped up the shift to EVs by setting up a large number of charging stations.

Electric Vehicle Market Opportunity: Government initiatives pertaining EVs

Countries around the world have set targets to reduce vehicle emissions by 2030-2050. They have started promoting the development and sales of EV market and related charging infrastructure. For instance, the US government invested USD 5 billion in 2017 in electric vehicle industry to promote electric vehicle infrastructure such as charging stations. Several governments are providing various incentives such as low or zero registration fees and exemptions from import taxes, purchase taxes, and road taxes to adopt EVs.

Norway and Germany are investing significantly in promoting sales of EV market. Thus, due to the high incentives and subsidies in Europe, a high growth rate in the sale of electric vehicles is observed. This has led to the growth in demand for components and equipment associated with EV charging, such as charging cables, connectors, adapters, and portable chargers. As part of a partnership between the US energy and transportation departments, a new vision for a national fast-charging network is expected to be developed, with potential longer-term innovations that include up to 350 kW of direct current fast charging. Stringent CO2 emission norms have increased the demand for electric vehicles. Governments are investing significantly in providing incentives and subsidies to encourage the sales of EVs. These steps undertaken by governments around the world are expected to help increase demand for EVs during the coming decade. China, Canada, and US have set up regulations for EVs, while all countries have set up fuel economy standards. They also provide incentives and subsidies for EV manufacturers and buyers. The US provides incentives of up to USD 7,500 for buying new EVs. Most of these countries also provide incentives for the setup of EV charging points. Europe is expected to be the first region with plans to fully shift to EVs. Most countries in the region have announced plans to stop ICE vehicle sales in the coming decades. The UK aims at dominating the entire vehicle market with EV sales by 2030. Norway plans to undertake the same initiative and complete it by 2025. The Netherlands, Israel, Ireland, Iceland, and Denmark have made plans to adopt EVs by 2030. China and Japan also plan to stop ICE vehicle sales by 2035. 

Challenge: Insufficient standardization of EV charging infrastructure

Factors such as variation in charging loads have emphasized the need to standardize electric vehicle charging stations. EV charging stations may only be compatible with certain types of voltages. For instance, AC charging stations provide a voltage of 120V AC through level 1 charging stations and 208/240V AC through level 2 charging stations, while DC charging stations provide fast charging through 480V AC. Governments need to standardize charging infrastructure to develop a favorable ecosystem and increase the sales of EVs. Different countries use different standards for fast charging. Japan uses CHAdeMO; Europe, the US, and Korea use CCS; and China uses GB/T. The Indian government had mandated the installation of CHAdeMO and CCS methods since the country has not reached standardization in fast charging methods. Though, this mandate increased the installation cost of charging stations. Hence, in July 2019, the government changed the guidelines and allowed charging station developers to choose their preferred method. The US-based electric car maker Tesla uses high-performance superchargers unique to Tesla and cannot be used for other EVs. The lack of standardization across countries may impact the installation of charging stations and hamper the growth of the electric vehicle charging station market. The use of these different charging standards around the world is a barrier to standardization for EV charging stations. While companies are moving toward the use of a common socket or multiple types of sockets in charging stations, there is still a long way to go in the standardization of all charging points. Standardization of charging points would simplify charging EVs in public and lead to faster growth of EV demand worldwide.

The passenger car segment to be the largest segment during the forecast period

The electric vehicle market for passenger cars is largest in Asia Pacific followed by Europe and North America. In Asia, China, Japan and South Korea are the countries leading the passenger EV market in the region. This is due to the strong government support for passenger EV’s in these countries. Germany, France, Netherlands, Norway, Sweden, UK etc. are the top countries in the European region with a growing demand for EV passenger vehicles. These countries have come out with string emission regulations and a variety of subsidies, grants and incentives for shifting to EV’s. in 2020, due to these measures, Europe’s EV sales went beyond China’s EV sales, but China sold more EVs in 2021 due to the growing demand of mini-EVs. North America is also increasing EV passenger car demand with various states in US and Canada leading the electrifying trend. MEA countries have started to increase their EV market and are expected to be the fastest growing market in the coming years.  

Rear wheel Drive EV’s to be the fastest growing in demand during the forecast period

The demand for RWD EV’s has been on the increase across all regions, particularly across Asia Pacific and Europe. This is due to its easier vehicle control and growing demand for these vehicles. North America also has seen a faster growth in these vehicles with Tesla Model 3 Standard version, BMW i3, Volkswagen ID4, Porsche Tycan etc. leading the market. In the coming decade, the growth of RWD EV’s will be highest in MEA due to its newer market and mostly across Asia Pacific. The Wuling Hongguang Mini EV which made a big splash in the EV market in 2020 and 2021 is also a RWD popular across Asia and Europe.  

The Asia Pacific market is projected to hold the largest electric vehicle market share

The Asia Pacific electric vehicle market is led by countries like China, Japan and South Korea. China being the world’s largest EV producer and user has a dominance in the global EV market share in the region. Their government has taken steps including subsidies for EV buyers, compulsory laws by which all vehicle manufacturers need to manufacture EV’s per number of vehicles manufactured, large support to installation of EV charging points across major cities and regulations against excessive polluting vehicles. Japan and South Korea have also been growing their EV market. Their governments have supported the EV demand growth by installing EV charging stations, making emission norms, setting up deadlines for shifting to full or hybrid EV’s from ICE vehicles etc. India is also working on increasing its EV demand in the market. The new vehicle scrappage policy in which old vehicles can be scrapped off for changing to low emission ones and other upcoming policy’s will help the country become the regions fastest growing market for EV’s in the coming years. Thailand, Indonesia, Malaysia, and Vietnam have also started working to reduce their vehicle emissions and shift to the use of EVs.

Recent Developments

  • In February 2022, MG Motors showcased its upcoming EV, the MG 4, which is expected to launch in India later in 2022. The EV will come with a 61.1 kWh battery pack and is expected to run around 400 km.
  • In January 2022, Volkswagen announced the development of its ID.5 model based on the Skoda Enayaq iV model. The vehicle is expected to have a range of around 300 miles on 1 charge.
  • In December 2021, BYD launched its new second-generation e6 EV for the Indian market. The deliveries for this model were started by February 2022. This MPV comes with a 71.7 kWh battery pack and a range of around 250+ miles per charge.
  • In November 2021, BMW launched its new i4 electric sedan with a range of approximately 300-367 miles. The vehicle can reach 100 km/hour in just four seconds. It comes with automatic transmission and connected vehicle features.
  • In June  2021, Opel/Vauxhall, a subsidiary of Stellantis, launched its Mokka EV, which comes with a max range of 209 miles and a 50kWh battery. The car is FWD and comes with connected vehicle features.
  • In April 2021, BYD launched four new electric vehicle models equipped with Blade battery in Chongqing. The new vehicle models, Tang EV, Qin Plus EV, Song Plus EV and E2 2021 come with advanced battery safety features.
  • In April 2021, Volkswagen unveiled the 7 seater EV ID.6 Crozz and ID.6 X produced along with FAW and SAIC in China. The vehicles will be sold only in China. It comes in two battery versions, 58 kWh and 77 kWh and come in four powertrain configurations.
  • In March 2021, Volvo showcased its new C40 Recharge model. The vehicle is designed as a pure electric car and has most features similar to its XC60 model. 
  • In December 2020, Nissan announced 2021 Leaf model in US. The vehicle comes with a choice of battery between 40 kWh and 62 kWh. The mileage ranges between 149 miles and 226 miles per charge.

Some of the prominent players in the Electric Vehicle Market include:

  • Ampere Vehicles
  • Benling India Energy and Technology Pvt Ltd
  • BMW AG
  • BYD Company Limited
  • Chevrolet Motor Company
  • Daimler AG
  • Energica Motor Company S.p.A.
  • Ford Motor Company
  • General Motors
  • Hero Electric
  • Hyundai Motor Company
  • Karma Automotive
  • Kia Corporation
  • Lucid Group, Inc.
  • Mahindra Electric Mobility Limited
  • NIO
  • Nissan Motors Co., Ltd.
  • Okinawa Autotech Pvt. Ltd.
  • Rivain
  • Tata Motors
  • Tesla Inc.
  • Toyota Motor Corporation
  • Volkswagen AG
  • WM Motor
  • Xiaopeng Motors

Segments Covered in the Report

This report forecasts revenue growth at global, regional, and country levels and provides an analysis of the latest industry trends in each of the sub-segments from 2018 to 2032. For this study, Nova one advisor, Inc. has segmented the global Electric Vehicle market.

By Propulsion Type

  • Hybrid Vehicles
  • Pure Hybrid Vehicles
  • Plug-in Hybrid Vehicles
  • Battery Electric Vehicles
  • Fuel Cell Electric Vehicles

By Components

  • Battery Cells & Packs
  • On-Board Charge
  • Motor
  • Reducer
  • Fuel Stack
  • Power Control Unit
  • Battery Management System
  • Fuel Processor
  • Power Conditioner
  • Air Compressor
  • Humidifier

By Vehicle Type

  • Passenger Cars
  • Commercial Vehicles
  • Two-Wheelers
  • E-Scooters & Bikes
  • Light Commercial Vehicles
  • Others

By Vehicle Class

  • Mid-priced
  • Luxury

By Top Speed

  • Less Than 100 MPH
  • 100 to 125 MPH
  • More Than 125 MPH

By Vehicle Drive

  • Front-Wheel Drive
  • Rear Wheel Drive
  • All Wheel Drive

By EV Charging Point Type

  • Normal Charging
  • Super Charging

By V2G

  • V2B or V2H
  • V2G
  • V2V
  • V2X

By Region

  • North America
  • Europe
  • Asia-Pacific
  • Latin America
  • Middle East & Africa (MEA)


Chapter 1. Introduction

1.1. Research Objective

1.2. Scope of the Study

1.3. Definition

Chapter 2. Research Methodology

2.1. Research Approach

2.2. Data Sources

2.3. Assumptions & Limitations

Chapter 3. Executive Summary

3.1. Market Snapshot

Chapter 4. Market Variables and Scope 

4.1. Introduction

4.2. Market Classification and Scope

4.3. Industry Value Chain Analysis

4.3.1. Raw Material Procurement Analysis 

4.3.2. Sales and Distribution Channel Analysis

4.3.3. Downstream Buyer Analysis

Chapter 5. Market Dynamics Analysis and Trends

5.1. Market Dynamics

5.1.1. Market Drivers

5.1.2. Market Restraints

5.1.3. Market Opportunities

5.2. Porter’s Five Forces Analysis

5.2.1. Bargaining power of suppliers

5.2.2. Bargaining power of buyers

5.2.3. Threat of substitute

5.2.4. Threat of new entrants

5.2.5. Degree of competition

Chapter 6. Competitive Landscape

6.1.1. Company Market Share/Positioning Analysis

6.1.2. Key Strategies Adopted by Players

6.1.3. Vendor Landscape

6.1.3.1. List of Suppliers

6.1.3.2. List of Buyers

Chapter 7. Global Electric Vehicle Market, By Propulsion Type

7.1. Electric Vehicle Market, by Propulsion Type, 2023-2032

7.1.1. Hybrid Vehicles

7.1.1.1. Market Revenue and Forecast (2018-2032)

7.1.2. Battery Electric Vehicles

7.1.2.1. Market Revenue and Forecast (2018-2032)

7.1.3. Fuel Cell Electric Vehicles

7.1.3.1. Market Revenue and Forecast (2018-2032)

Chapter 8. Global Electric Vehicle Market, By Components

8.1. Electric Vehicle Market, by Components, 2023-2032

8.1.1. Battery Cells & Packs

8.1.1.1. Market Revenue and Forecast (2018-2032)

8.1.2. On-Board Charge

8.1.2.1. Market Revenue and Forecast (2018-2032)

8.1.3. Motors

8.1.3.1. Market Revenue and Forecast (2018-2032)

8.1.4. Reducer

8.1.4.1. Market Revenue and Forecast (2018-2032)

8.1.5. Fuel Stack

8.1.5.1. Market Revenue and Forecast (2018-2032)

8.1.6. Power Control Unit

8.1.6.1. Market Revenue and Forecast (2018-2032)

8.1.7. Battery Management System

8.1.7.1. Market Revenue and Forecast (2018-2032)

8.1.8. Fuel Processor

8.1.8.1. Market Revenue and Forecast (2018-2032)

8.1.9. Power Conditioner

8.1.9.1. Market Revenue and Forecast (2018-2032)

8.1.10. Air Compressor

8.1.10.1. Market Revenue and Forecast (2018-2032)

8.1.11. Humidifier

8.1.11.1. Market Revenue and Forecast (2018-2032)

Chapter 9. Global Electric Vehicle Market, By Vehicle Type

9.1. Electric Vehicle Market, by Vehicle Type, 2023-2032

9.1.1. Passenger Cars

9.1.1.1. Market Revenue and Forecast (2018-2032)

9.1.2. Commercial Vehicles

9.1.2.1. Market Revenue and Forecast (2018-2032)

9.1.3. Two-Wheelers

9.1.3.1. Market Revenue and Forecast (2018-2032)

9.1.4. E-Scooters & Bikes

9.1.4.1. Market Revenue and Forecast (2018-2032)

9.1.5. Light Commercial Vehicles

9.1.5.1. Market Revenue and Forecast (2018-2032)

Chapter 10. Global Electric Vehicle  Market, By Vehicle Class

10.1. Electric Vehicle Market, by Vehicle Class, 2023-2032

10.1.1. Mid-priced

10.1.1.1. Market Revenue and Forecast (2018-2032)

10.1.2. Luxury

10.1.2.1. Market Revenue and Forecast (2018-2032)

Chapter 11. Global Electric Vehicle  Market, By Top Speed

11.1. Electric Vehicle  Market, by Top Speed, 2023-2032

11.1.1. Less Than 100 MPH

11.1.1.1. Market Revenue and Forecast (2018-2032)

11.1.2. 100 to 125 MPH

11.1.2.1. Market Revenue and Forecast (2018-2032)

11.1.3. More Than 125 MPH

11.1.3.1. Market Revenue and Forecast (2018-2032)

Chapter 12. Global Electric Vehicle  Market, By Vehicle Drive

12.1. Electric Vehicle  Market, by Vehicle Drive, 2023-2032

12.1.1. Front-Wheel Drive

12.1.1.1. Market Revenue and Forecast (2018-2032)

12.1.2. Rear Wheel Drive

12.1.2.1. Market Revenue and Forecast (2018-2032)

12.1.3. All Wheel Drive

12.1.3.1. Market Revenue and Forecast (2018-2032)

Chapter 13. Global Electric Vehicle  Market, By EV Charging Point

13.1. Electric Vehicle Market, by EV Charging Point, 2023-2032

13.1.1. Normal Charging

13.1.1.1. Market Revenue and Forecast (2018-2032)

13.1.2. Super Charging

13.1.2.1. Market Revenue and Forecast (2018-2032)

Chapter 14. Global Electric Vehicle  Market, By V2G

14.1. Electric Vehicle Market, by EV Charging Point, 2023-2032

14.1.1. V2B or V2H

14.1.1.1. Market Revenue and Forecast (2018-2032)

14.1.2. V2G

14.1.2.1. Market Revenue and Forecast (2018-2032)

14.1.3. V2V

14.1.3.1. Market Revenue and Forecast (2018-2032)

14.1.4. V2X

14.1.4.1. Market Revenue and Forecast (2018-2032)

Chapter 15. Global Electric Vehicle Market, Regional Estimates and Trend Forecast

15.1. North America

15.1.1. Market Revenue and Forecast, by Propulsion Type (2018-2032)

15.1.2. Market Revenue and Forecast, by Components (2018-2032)

15.1.3. Market Revenue and Forecast, by Vehicle Type (2018-2032)

15.1.4. Market Revenue and Forecast, by Vehicle Class (2018-2032)

15.1.5. Market Revenue and Forecast, by Top Speed (2018-2032)

15.1.6. Market Revenue and Forecast, by EV Charging Point (2018-2032)

15.1.7. Market Revenue and Forecast, by Vehicle Drive (2018-2032)

15.1.8. U.S.

15.1.8.1. Market Revenue and Forecast, by Propulsion Type (2018-2032)

15.1.8.2. Market Revenue and Forecast, by Components (2018-2032)

15.1.8.3. Market Revenue and Forecast, by Vehicle Type (2018-2032)

15.1.8.4. Market Revenue and Forecast, by Vehicle Class (2018-2032)

15.1.8.5. Market Revenue and Forecast, by Top Speed (2018-2032)

15.1.8.6. Market Revenue and Forecast, by EV Charging Point (2018-2032)

15.1.8.7. Market Revenue and Forecast, by Vehicle Drive (2018-2032)

15.1.9. Rest of North America

15.1.9.1. Market Revenue and Forecast, by Propulsion Type (2018-2032)

15.1.9.2. Market Revenue and Forecast, by Components (2018-2032)

15.1.9.3. Market Revenue and Forecast, by Vehicle Type (2018-2032)

15.1.9.4. Market Revenue and Forecast, by Vehicle Class (2018-2032)

15.1.9.5. Market Revenue and Forecast, by Top Speed (2018-2032)

15.1.9.6. Market Revenue and Forecast, by EV Charging Point (2018-2032)

15.1.9.7. Market Revenue and Forecast, by Vehicle Drive (2018-2032)

15.2. Europe

15.2.1. Market Revenue and Forecast, by Propulsion Type (2018-2032)

15.2.2. Market Revenue and Forecast, by Components (2018-2032)

15.2.3. Market Revenue and Forecast, by Vehicle Type (2018-2032)

15.2.4. Market Revenue and Forecast, by Vehicle Class (2018-2032)

15.2.5. Market Revenue and Forecast, by Top Speed (2018-2032)

15.2.6. Market Revenue and Forecast, by EV Charging Point (2018-2032)

15.2.7. Market Revenue and Forecast, by Vehicle Drive (2018-2032)

15.2.8. UK

15.2.8.1. Market Revenue and Forecast, by Propulsion Type (2018-2032)

15.2.8.2. Market Revenue and Forecast, by Components (2018-2032)

15.2.8.3. Market Revenue and Forecast, by Vehicle Type (2018-2032)

15.2.8.4. Market Revenue and Forecast, by Vehicle Class (2018-2032)

15.2.8.5. Market Revenue and Forecast, by Top Speed (2018-2032)

15.2.8.6. Market Revenue and Forecast, by EV Charging Point (2018-2032)

15.2.8.7. Market Revenue and Forecast, by Vehicle Drive (2018-2032)

15.2.9. Germany

15.2.9.1. Market Revenue and Forecast, by Propulsion Type (2018-2032)

15.2.9.2. Market Revenue and Forecast, by Components (2018-2032)

15.2.9.3. Market Revenue and Forecast, by Vehicle Type (2018-2032)

15.2.9.4. Market Revenue and Forecast, by Vehicle Class (2018-2032)

15.2.9.5. Market Revenue and Forecast, by Top Speed (2018-2032)

15.2.9.6. Market Revenue and Forecast, by EV Charging Point (2018-2032)

15.2.9.7. Market Revenue and Forecast, by Vehicle Drive (2018-2032)

15.2.10. France

15.2.10.1. Market Revenue and Forecast, by Propulsion Type (2018-2032)

15.2.10.2. Market Revenue and Forecast, by Components (2018-2032)

15.2.10.3. Market Revenue and Forecast, by Vehicle Type (2018-2032)

15.2.10.4. Market Revenue and Forecast, by Vehicle Class (2018-2032)

15.2.10.5. Market Revenue and Forecast, by Top Speed (2018-2032)

15.2.10.6. Market Revenue and Forecast, by EV Charging Point (2018-2032)

15.2.10.7. Market Revenue and Forecast, by Vehicle Drive (2018-2032)

15.2.11. Rest of Europe

15.2.11.1. Market Revenue and Forecast, by Propulsion Type (2018-2032)

15.2.11.2. Market Revenue and Forecast, by Components (2018-2032)

15.2.11.3. Market Revenue and Forecast, by Vehicle Type (2018-2032)

15.2.11.4. Market Revenue and Forecast, by Vehicle Class (2018-2032)

15.2.11.5. Market Revenue and Forecast, by Top Speed (2018-2032)

15.2.11.6. Market Revenue and Forecast, by EV Charging Point (2018-2032)

15.2.11.7. Market Revenue and Forecast, by Vehicle Drive (2018-2032)

15.3. APAC

15.3.1. Market Revenue and Forecast, by Propulsion Type (2018-2032)

15.3.2. Market Revenue and Forecast, by Components (2018-2032)

15.3.3. Market Revenue and Forecast, by Vehicle Type (2018-2032)

15.3.4. Market Revenue and Forecast, by Vehicle Class (2018-2032)

15.3.5. Market Revenue and Forecast, by Top Speed (2018-2032)

15.3.6. Market Revenue and Forecast, by EV Charging Point (2018-2032)

15.3.7. Market Revenue and Forecast, by Vehicle Drive (2018-2032)

15.3.8. India

15.3.8.1. Market Revenue and Forecast, by Propulsion Type (2018-2032)

15.3.8.2. Market Revenue and Forecast, by Components (2018-2032)

15.3.8.3. Market Revenue and Forecast, by Vehicle Type (2018-2032)

15.3.8.4. Market Revenue and Forecast, by Vehicle Class (2018-2032)

15.3.8.5. Market Revenue and Forecast, by Top Speed (2018-2032)

15.3.8.6. Market Revenue and Forecast, by EV Charging Point (2018-2032)

15.3.8.7. Market Revenue and Forecast, by Vehicle Drive (2018-2032)

15.3.9. China

15.3.9.1. Market Revenue and Forecast, by Propulsion Type (2018-2032)

15.3.9.2. Market Revenue and Forecast, by Components (2018-2032)

15.3.9.3. Market Revenue and Forecast, by Vehicle Type (2018-2032)

15.3.9.4. Market Revenue and Forecast, by Vehicle Class (2018-2032)

15.3.9.5. Market Revenue and Forecast, by Top Speed (2018-2032)

15.3.9.6. Market Revenue and Forecast, by EV Charging Point (2018-2032)

15.3.9.7. Market Revenue and Forecast, by Vehicle Drive (2018-2032)

15.3.10. Japan

15.3.10.1. Market Revenue and Forecast, by Propulsion Type (2018-2032)

15.3.10.2. Market Revenue and Forecast, by Components (2018-2032)

15.3.10.3. Market Revenue and Forecast, by Vehicle Type (2018-2032)

15.3.10.4. Market Revenue and Forecast, by Vehicle Class (2018-2032)

15.3.10.5. Market Revenue and Forecast, by Top Speed (2018-2032)

15.3.10.6. Market Revenue and Forecast, by EV Charging Point (2018-2032)

15.3.10.7. Market Revenue and Forecast, by Vehicle Drive (2018-2032)

15.3.11. Rest of APAC

15.3.11.1. Market Revenue and Forecast, by Propulsion Type (2018-2032)

15.3.11.2. Market Revenue and Forecast, by Components (2018-2032)

15.3.11.3. Market Revenue and Forecast, by Vehicle Type (2018-2032)

15.3.11.4. Market Revenue and Forecast, by Vehicle Class (2018-2032)

15.3.11.5. Market Revenue and Forecast, by Top Speed (2018-2032)

15.3.11.6. Market Revenue and Forecast, by EV Charging Point (2018-2032)

15.3.11.7. Market Revenue and Forecast, by Vehicle Drive (2018-2032)

15.4. MEA

15.4.1. Market Revenue and Forecast, by Propulsion Type (2018-2032)

15.4.2. Market Revenue and Forecast, by Components (2018-2032)

15.4.3. Market Revenue and Forecast, by Vehicle Type (2018-2032)

15.4.4. Market Revenue and Forecast, by Vehicle Class (2018-2032)

15.4.5. Market Revenue and Forecast, by Top Speed (2018-2032)

15.4.6. Market Revenue and Forecast, by EV Charging Point (2018-2032)

15.4.7. Market Revenue and Forecast, by Vehicle Drive (2018-2032)

15.4.8. GCC

15.4.8.1. Market Revenue and Forecast, by Propulsion Type (2018-2032)

15.4.8.2. Market Revenue and Forecast, by Components (2018-2032)

15.4.8.3. Market Revenue and Forecast, by Vehicle Type (2018-2032)

15.4.8.4. Market Revenue and Forecast, by Vehicle Class (2018-2032)

15.4.8.5. Market Revenue and Forecast, by Top Speed (2018-2032)

15.4.8.6. Market Revenue and Forecast, by EV Charging Point (2018-2032)

15.4.8.7. Market Revenue and Forecast, by Vehicle Drive (2018-2032)

15.4.9. North Africa

15.4.9.1. Market Revenue and Forecast, by Propulsion Type (2018-2032)

15.4.9.2. Market Revenue and Forecast, by Components (2018-2032)

15.4.9.3. Market Revenue and Forecast, by Vehicle Type (2018-2032)

15.4.9.4. Market Revenue and Forecast, by Vehicle Class (2018-2032)

15.4.9.5. Market Revenue and Forecast, by Top Speed (2018-2032)

15.4.9.6. Market Revenue and Forecast, by EV Charging Point (2018-2032)

15.4.9.7. Market Revenue and Forecast, by Vehicle Drive (2018-2032)

15.4.10. South Africa

15.4.10.1. Market Revenue and Forecast, by Propulsion Type (2018-2032)

15.4.10.2. Market Revenue and Forecast, by Components (2018-2032)

15.4.10.3. Market Revenue and Forecast, by Vehicle Type (2018-2032)

15.4.10.4. Market Revenue and Forecast, by Vehicle Class (2018-2032)

15.4.10.5. Market Revenue and Forecast, by Top Speed (2018-2032)

15.4.10.6. Market Revenue and Forecast, by EV Charging Point (2018-2032)

15.4.10.7. Market Revenue and Forecast, by Vehicle Drive (2018-2032)

15.4.11. Rest of MEA

15.4.11.1. Market Revenue and Forecast, by Propulsion Type (2018-2032)

15.4.11.2. Market Revenue and Forecast, by Components (2018-2032)

15.4.11.3. Market Revenue and Forecast, by Vehicle Type (2018-2032)

15.4.11.4. Market Revenue and Forecast, by Vehicle Class (2018-2032)

15.4.11.5. Market Revenue and Forecast, by Top Speed (2018-2032)

15.4.11.6. Market Revenue and Forecast, by EV Charging Point (2018-2032)

15.4.11.7. Market Revenue and Forecast, by Vehicle Drive (2018-2032)

15.5. Latin America

15.5.1. Market Revenue and Forecast, by Propulsion Type (2018-2032)

15.5.2. Market Revenue and Forecast, by Components (2018-2032)

15.5.3. Market Revenue and Forecast, by Vehicle Type (2018-2032)

15.5.4. Market Revenue and Forecast, by Vehicle Class (2018-2032)

15.5.5. Market Revenue and Forecast, by Top Speed (2018-2032)

15.5.6. Market Revenue and Forecast, by EV Charging Point (2018-2032)

15.5.7. Market Revenue and Forecast, by Vehicle Drive (2018-2032)

15.5.8. Brazil

15.5.8.1. Market Revenue and Forecast, by Propulsion Type (2018-2032)

15.5.8.2. Market Revenue and Forecast, by Components (2018-2032)

15.5.8.3. Market Revenue and Forecast, by Vehicle Type (2018-2032)

15.5.8.4. Market Revenue and Forecast, by Vehicle Class (2018-2032)

15.5.8.5. Market Revenue and Forecast, by Top Speed (2018-2032)

15.5.8.6. Market Revenue and Forecast, by EV Charging Point (2018-2032)

15.5.8.7. Market Revenue and Forecast, by Vehicle Drive (2018-2032)

15.5.9. Rest of LATAM

15.5.9.1. Market Revenue and Forecast, by Propulsion Type (2018-2032)

15.5.9.2. Market Revenue and Forecast, by Components (2018-2032)

15.5.9.3. Market Revenue and Forecast, by Vehicle Type (2018-2032)

15.5.9.4. Market Revenue and Forecast, by Vehicle Class (2018-2032)

15.5.9.5. Market Revenue and Forecast, by Top Speed (2018-2032)

15.5.9.6. Market Revenue and Forecast, by EV Charging Point (2018-2032)

15.5.9.7. Market Revenue and Forecast, by Vehicle Drive (2018-2032)

Chapter 16. Company Profiles

16.1. Ampere Vehicles

16.1.1. Company Overview

16.1.2. Product Offerings

16.1.3. Financial Performance

16.1.4. Recent Initiatives

16.2. Benling India Energy and Technology Pvt Ltd

16.2.1. Company Overview

16.2.2. Product Offerings

16.2.3. Financial Performance

16.2.4. Recent Initiatives

16.3. BMW AG

16.3.1. Company Overview

16.3.2. Product Offerings

16.3.3. Financial Performance

16.3.4. Recent Initiatives

16.4. BYD Company Limited

16.4.1. Company Overview

16.4.2. Product Offerings

16.4.3. Financial Performance

16.4.4. Recent Initiatives

16.5. Chevrolet Motor Company

16.5.1. Company Overview

16.5.2. Product Offerings

16.5.3. Financial Performance

16.5.4. Recent Initiatives

16.6. Daimler AG

16.6.1. Company Overview

16.6.2. Product Offerings

16.6.3. Financial Performance

16.6.4. Recent Initiatives

16.7. Energica Motor Company S.p.A.

16.7.1. Company Overview

16.7.2. Product Offerings

16.7.3. Financial Performance

16.7.4. Recent Initiatives

16.8. Ford Motor Company

16.8.1. Company Overview

16.8.2. Product Offerings

16.8.3. Financial Performance

16.8.4. Recent Initiatives

16.9. General Motors

16.9.1. Company Overview

16.9.2. Product Offerings

16.9.3. Financial Performance

16.9.4. Recent Initiatives

16.10. Hero Electric

16.10.1. Company Overview

16.10.2. Product Offerings

16.10.3. Financial Performance

16.10.4. Recent Initiatives

16.11. Hyundai Motor Company

16.11.1. Company Overview

16.11.2. Product Offerings

16.11.3. Financial Performance

16.11.4. Recent Initiatives

16.12. Karma Automotive

16.12.1. Company Overview

16.12.2. Product Offerings

16.12.3. Financial Performance

16.12.4. Recent Initiatives

16.13. Kia Corporation

16.13.1. Company Overview

16.13.2. Product Offerings

16.13.3. Financial Performance

16.13.4. Recent Initiatives

16.14. Lucid Group, Inc.

16.14.1. Company Overview

16.14.2. Product Offerings

16.14.3. Financial Performance

16.14.4. Recent Initiatives

16.15. Tesla Inc.

16.15.1. Company Overview

16.15.2. Product Offerings

16.15.3. Financial Performance

16.15.4. Recent Initiatives

Chapter 17. Research Methodology

17.1. Primary Research

17.2. Secondary Research

17.3. Assumptions

Chapter 18. Appendix

18.1. About Us

18.2. Glossary of Terms

Proceed To Buy

USD 4500
USD 3800
USD 1900
USD 1200

Customization Offered

  • check-imgCross-segment Market Size and Analysis for Mentioned Segments
  • check-imgAdditional Company Profiles (Upto 5 With No Cost)
  • check-img Additional Countries (Apart From Mentioned Countries)
  • check-img Country/Region-specific Report
  • check-img Go To Market Strategy
  • check-imgRegion Specific Market Dynamics
  • check-imgRegion Level Market Share
  • check-img Import Export Analysis
  • check-imgProduction Analysis
  • check-imgOthers