Energy Management Systems Market (By Product: IEMS, BEMS, HEMS; By Component: Sensors, Controllers, Software, Batteries, Display Devices, Others; By Solution: Carbon Energy Management, Demand Response Management, Utility Billing and Customer Information System; By Vertical: Power & Energy, Telecom & IT, Manufacturing, Retail & Offices, Healthcare, Others; By End Use) - Global Industry Analysis, Size, Share, Growth, Trends, Regional Outlook, and Forecast 2023 – 2032

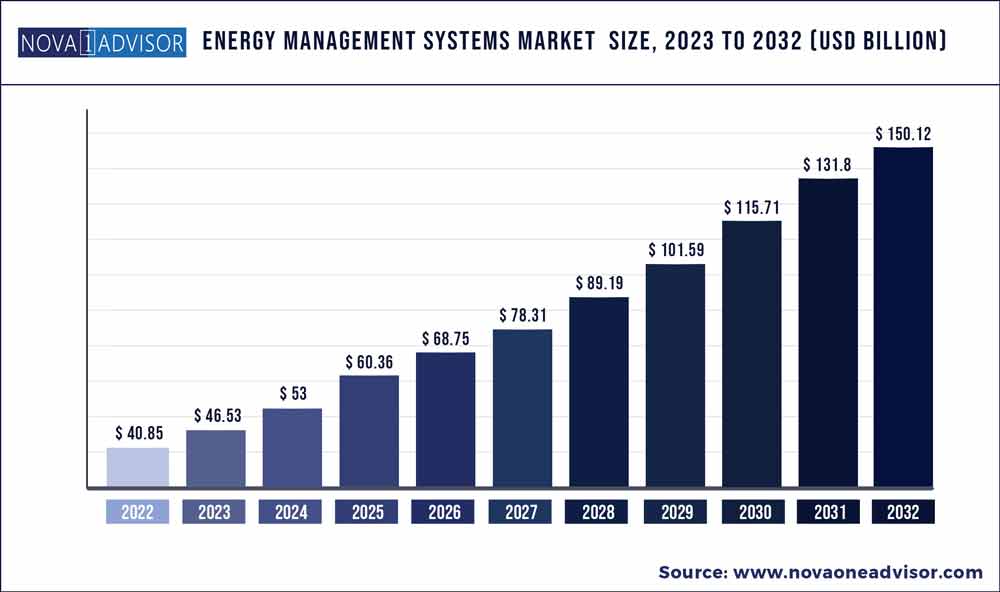
The global energy management systems market size accounted for USD 40.85 billion in 2022 and is estimated to achieve a market size of USD 150.12 billion by 2032 growing at a CAGR of 13.9% from 2023 to 2032.

energy management systems market size

Key Pointers:

  • The industrial energy management system (IEMS) segment accounted for the largest market share of over 70.19% in 2022.
  • The hardware segment accounted for the largest market share of over 60.45% in 2022. 
  • The on-premises segment accounted for the largest market share of over 80.10% in 2022. 
  • The manufacturing segment accounted for the largest market share of over 20.8% in 2022.
  • North America accounted for the largest market share of over 35.9% in 2022.

Energy Management Systems Market Report Scope

Report Coverage Details
Market size value in 2023 USD 40.85 Billion
Revenue forecast in 2032 USD 150.12 Billion
Growth Rate CAGR of 13.9%
Base year 2022
Forecast Period 2023 to 2032
Largest Market Asia Pacific
Fastest Growing Market North America
Segments Covered Product, Component, Solution, Vertical, End Use, Geography


An uptick in the management of energy use across commercial, industrial, and public sector organizations has fueled the demand for energy management systems (EMS). Implementing advanced energy-efficient technologies and reducing energy waste will gain ground to contain greenhouse gas emissions, minimize the potential exposure to fluctuating energy prices and bolster productivity. In February 2020, the World Resources Institute cited data suggesting that energy consumption was the biggest source of human-caused greenhouse gas emissions. Amidst the prevailing trend, industry players could seek IoT-based solutions to optimize energy consumption and control the energy flow.

Soaring installation of Energy Management Systems (EMS) has emerged as an invaluable practice to enhance performance and sustainable energy efficiency. Stakeholders have prioritized energy reduction to minimize greenhouse gas emissions and costs and boost the energy supply chain. EMS is poised to gain ground with utilities seeking increased operational control and visibility. Prominently, the expanding footfall of smart buildings has expedited the installation of smart grids and smart meters, thereby bolstering market growth.

Smart homes have reinforced the value proposition of energy management by monitoring energy usage. Besides, electricity providers have exhibited an inclination for intelligent solutions, including smart thermostats and smart sensors. The rising footprint of Industry 4.0, cloud analytics, IoT and sensors will solidify the position of leading companies gearing to boost their portfolios. In essence, smart energy management has gained ground in controlling, monitoring, optimizing, and measuring energy consumption. Industry players are also expected to bank on AI-powered EMS to manage and monitor the behavioral patterns of the system and optimize energy usage.

Industrial energy management systems (IEMS) have emerged as a promising source to help minimize energy costs and underpin resiliency. Industrial companies with production facilities, warehouses and aftermarket services have prioritized EMS to expand their footfall across under-penetrated areas. Notably, smart solutions have fueled the trend to streamline energy management across North America, Europe and the Asia Pacific. With sustainable energy receiving impetus, smart energy management could add a fillip to the global market.

EMS solutions are expected to help minimize production risk, cut quality and compliance costs and enhance energy use. Some factors, such as volatile energy costs and the adoption of state-of-the-art technologies, will foster energy management systems market value. Stakeholders anticipate smart IEMS to streamline efficient energy management, real-time monitoring of metering locations, reduce downtime, maximize energy savings, and reduce OPEX. Moreover, the prevailing trends allude to a strong inclination towards IEMS across automotive, oil & gas, manufacturing, and food & beverage industries, auguring well for the market growth.

Asia Pacific could witness investment galore with the rising footprint of clouds across China, Japan, Australia, and India. To illustrate, in November 2021, ELES collaborated with New Energy and Industrial Technology Development Organization (NEDO) and Hitachi, Ltd. to complete the cloud-based Advanced Energy Management System (AEMS). Cloud-based AEMS has become sought-after for voltage dips mitigation measures, autonomous operation during power grid accidents and providing flexibility to the electricity transmission system. Real-time data sources have become trendier in giving information on weather forecasts and the current and future energy market. Moreover, IoT and AI-based solutions will gain prominence across Building Energy Management Systems (BEMS) and Home Energy Management Systems (HEMS) for enhanced security, savings, and efficiency.

Besides, Eaton will apparently join forces on energy management system interoperability with Areti, Terna and ENEL in Rome and Copenhagen. Meanwhile, in October 2020, Emerson reportedly completed the acquisition of Open Systems International, Inc. (OSI Inc.) for USD 1.6 billion in an all-cash transaction. Emerson expects the acquisition will bolster the end-to-end ability to optimize, control and monitor real-time operations in the power sector. Leading companies are poised to prioritize advanced technologies to leverage real-time data to minimize energy consumption and bolster energy efficiency.

System Type Insights

The industrial energy management system (IEMS) segment accounted for the largest market share of over 70.19% in 2022. Building Energy Management Systems (BEMS) will grow with the soaring penetration of IoT devices and increasing connectivity. Smart buildings are likely to explore IoT and digital building solutions to leverage real-time data for the efficient and sustainable management of buildings. A paradigm shift witnessed towards Industry 4.0 and digital transformation has furthered the management, optimization and maintenance of the building. Besides, the electrification of space heating and cooling in buildings has augured well for market growth. Lately, metering devices have gained prominence to connect with the automation system and smartly acquire, assess and store information to boost efficiency. Stakeholders, including energy managers, building owners and electrical installers, are expected to count on BEMs for optimum energy consumption.

Home Energy Management Systems (HEMS) segment is expected to depict an impressive CAGR against the backdrop of soaring energy consumption. The EIA’s Annual Energy Outlook 2015 claimed that domestic consumption could rise by 0.8% annually through 2040. Energy optimization solutions, including a smart home’s electrical board and the use of software that helps detect energy consumption, are likely to foster home energy management systems. As space heating, air conditioning, water heating, lighting and appliances continue to be among the most significant uses of electricity in the residential sector, smart devices—smart sensors and smart meters—could gain further traction in the ensuing period. Expanding footfall of energy-conserving devices is slated to reinforce the demand for home energy management systems.

Component Insights

The hardware segment accounted for the largest market share of over 60.45% in 2022. The hardware segment could account for a sizable share of the global market in the wake of the growing penetration of sensing technology and communication. Besides, bridges and sensors have gained ground, with wired sensor networks receiving uptake for being more reliable, longer service lifetimes and less vulnerable to interference and disruptions. With monitoring and controlling building operations gaining a foothold to embed intelligence, hardware components could add fillip to the energy management systems market forecast during the forecast period.

The software could be a pivotal contributor to minimizing energy usage and offering information about consumption patterns. Software components have become trendier for actionable insights into energy data, to reduce energy costs and streamline workflow. The software has become sought-after to offer detailed energy information, such as the influence of weather and control data centers, HVAC, and manufacturing lines. The EMS software has also received an impetus to render accurate expenditure and consumption data. Furthermore, end-users have exhibited a profound inclination for the component to streamline the allocation of energy through real-time data-based load changes. With a host of companies assessing the significance of energy efficiency, the software could gain traction to boost collaboration and communication related to energy-related issues.

Deployment Insights

The on-premises segment accounted for the largest market share of over 80.10% in 2022. The cloud-based energy management systems will contribute significantly to the global market on the back of reduced costs and the need to combat carbon emissions. Cloud computing systems have enabled organizations to boost flexibility and help visualize, monitor and assess data remotely. End-users are slated to exhibit demand for cloud-based EMS for real-time visibility of energy. The cloud-based energy management systems have become sought-after to enable end-users to manage and monitor energy practices using IIoT devices. With innovative technologies and IoT playing a pivotal role in minimizing energy usage, the cloud will continue to receive impetus globally.

Leading companies have exhibited profound traction for cloud-based business models to combat soaring energy consumption and reduce carbon emissions. For instance, in March 2021, Oracle noted that Oracle Cloud Infrastructure helped Enloc Energy cut infrastructure costs by 30%. Industry players have also sought machine learning and other advanced technologies to adjust building energy settings. In February 2020, Honeywell rolled out the first autonomous building sustainability solution, Honeywell Forge Energy Optimization, to assess energy consumption patterns of buildings and automatically adjust to optimal energy-saving settings. Energy providers are likely to inject funds into the cloud for a seamless experience and bullish energy savings.

Vertical Insights

The manufacturing segment accounted for the largest market share of over 20.8% in 2022. While the automotive sector has emerged as a promising sub-segment in the energy management systems market, mainly due to the global push to migrate to a sustainable form of mobility. Heightened awareness about the upsides of electric vehicles and soaring environmental concerns have augmented the need for EMS. To illustrate, in September 2021, Ford Motor announced plans to bring electric zero-emission vehicles at scale with an auto production complex to boost sustainability solutions. Automakers are likely to bank on energy management to optimize energy consumption without hampering driving comfort and performance. EMS will be sought to offer visibility of energy usage and tools to reduce, manage and save consumption. EMS will continue to provide a promising opportunity to boost the capacity of the electrical infrastructure through load management and connecting/disconnecting processes.

The commercial segment could exhibit notable growth during the forecast period on the back of bullish government policies and soaring electricity consumption. Commercial sectors, including service-providing facilities, government facilities and private organizations, are expected to bank on EMS. With air conditioning, lighting, and heating and ventilation accounting for significant applications of electricity, EMS will receive a notable uptick across the U.S., the U.K., China, Australia and India. Energy management smart solutions have gained ground as cloud connectivity continues reinforcing market growth. Energy management plans are poised to help identify energy consumption and production solutions. EMS could be ripe with energy-efficiency potentials by helping make informed energy management investment decisions.

Regional Insights

North America accounted for the largest market share of over 35.9% in 2022. The U.S. and Canada are slated to provide revenue-generating opportunities with the surging penetration of smart grids and infrastructural spending. The IEA estimated investments in electricity grids would surge by 10% in 2021, with the U.S. being one of the major sources of infrastructural investments. Moreover, smart energy demand has witnessed a notable uptake across the region, encouraging stakeholders to inject funds into EMS. Prominently, residential, commercial, and building sectors are slated to exhibit strong demand for IoT-based solutions.

The growth trajectory is mainly attributed to an uptick in energy consumption for space heating and cooling. For instance, in June 2022, the U.S. Energy Information Administration cited the Annual Energy Outlook 2022 to suggest that almost 51% of the energy consumption in U.S. buildings in 2021 was used for heating and cooling. Furthermore, electricity providers and commercial and industrial companies are anticipated to emphasize clean energy technologies and connectivity to minimize carbon emissions and tap into the global market.

Industry participants are slated to unlock opportunities across the U.K., France, Italy and Germany as EMS continues to gain ground across the region. The growth is primarily due to the adoption of buoyant energy policies. In July 2022, the European Commission (all 27 EU member states) committed to reducing emissions by at least 56% by 2032. In addition, the U.K. government claims all buildings will be energy efficient with low carbon heating by 2050, while around 700,000 homes will be upgraded by 2025. Governments are likely to focus on minimizing energy consumption to cut energy costs and emissions; the trend could foster Europe energy management systems market share.

Some of the prominent players in the Energy Management Systems Market include:

  • Schneider Electric SE
  • Honeywell International Inc.
  • Siemens AG
  • Johnson Controls, Inc.
  • C3.ai, Inc.
  • GridPoint
  • General Electric
  • ABB
  • International Business Machines Corporation
  • Cisco Systems, Inc.

Segments Covered in the Report

This report forecasts revenue growth at global, regional, and country levels and provides an analysis of the latest industry trends in each of the sub-segments from 2018 to 2032. For this study, Nova one advisor, Inc. has segmented the global Energy Management Systems market.

By Product

  • Industrial Energy Management Systems (IEMS)
  • Building Energy Management Systems (BEMS)
  • Home Energy Management Systems (HEMS) 

By Component

  • Sensors
  • Controllers
  • Software
  • Batteries
  • Display Devices
  • Others

 By Solution

  • Carbon Energy Management
  • Demand Response Management
  • Utility Billing and Customer Information System

By Deployment

  • On-Premises
  • Cloud

By Vertical

  • Power & Energy
  • Telecom & IT
  • Manufacturing
  • Retail & Offices
  • Healthcare
  • Others

By End Use

  • Residential
  • Commercial

By Region

  • North America
  • Europe
  • Asia-Pacific
  • Latin America
  • Middle East & Africa (MEA)

Chapter 1. Introduction

1.1. Research Objective

1.2. Scope of the Study

1.3. Definition

Chapter 2. Research Methodology

2.1. Research Approach

2.2. Data Sources

2.3. Assumptions & Limitations

Chapter 3. Executive Summary

3.1. Market Snapshot

Chapter 4. Market Variables and Scope 

4.1. Introduction

4.2. Market Classification and Scope

4.3. Industry Value Chain Analysis

4.3.1. Raw Material Procurement Analysis 

4.3.2. Sales and Distribution Channel Analysis

4.3.3. Downstream Buyer Analysis

Chapter 5. COVID 19 Impact on Energy Management Systems Market 

5.1. COVID-19 Landscape: Energy Management Systems Industry Impact

5.2. COVID 19 - Impact Assessment for the Industry

5.3. COVID 19 Impact: Global Major Government Policy

5.4. Market Trends and Opportunities in the COVID-19 Landscape

Chapter 6. Market Dynamics Analysis and Trends

6.1. Market Dynamics

6.1.1. Market Drivers

6.1.2. Market Restraints

6.1.3. Market Opportunities

6.2. Porter’s Five Forces Analysis

6.2.1. Bargaining power of suppliers

6.2.2. Bargaining power of buyers

6.2.3. Threat of substitute

6.2.4. Threat of new entrants

6.2.5. Degree of competition

Chapter 7. Competitive Landscape

7.1.1. Company Market Share/Positioning Analysis

7.1.2. Key Strategies Adopted by Players

7.1.3. Vendor Landscape

7.1.3.1. List of Suppliers

7.1.3.2. List of Buyers

Chapter 8. Global Energy Management Systems Market, By Product

8.1. Energy Management Systems Market, by Product, 2023-2032

8.1.1. Industrial Energy Management Systems (IEMS)

8.1.1.1. Market Revenue and Forecast (2020-2032)

8.1.2. Building Energy Management Systems (BEMS)

8.1.2.1. Market Revenue and Forecast (2020-2032)

8.1.3. Home Energy Management Systems (HEMS)

8.1.3.1. Market Revenue and Forecast (2020-2032)

Chapter 9. Global Energy Management Systems Market, By Component

9.1. Energy Management Systems Market, by Component, 2023-2032

9.1.1. Sensors

9.1.1.1. Market Revenue and Forecast (2020-2032)

9.1.2. Controllers

9.1.2.1. Market Revenue and Forecast (2020-2032)

9.1.3. Software

9.1.3.1. Market Revenue and Forecast (2020-2032)

9.1.4. Batteries

9.1.4.1. Market Revenue and Forecast (2020-2032)

9.1.5. Display Devices

9.1.3.1. Market Revenue and Forecast (2020-2032)

9.1.6. Others

9.1.6.1. Market Revenue and Forecast (2020-2032)


Chapter 10. Global Energy Management Systems Market, By Solution 

10.1. Energy Management Systems Market, by Solution, 2023-2032

10.1.1. Carbon Energy Management

10.1.1.1. Market Revenue and Forecast (2020-2032)

10.1.2. Demand Response Management

10.1.2.1. Market Revenue and Forecast (2020-2032)

10.1.3. Utility Billing and Customer Information System

10.1.3.1. Market Revenue and Forecast (2020-2032)

Chapter 11. Global Energy Management Systems Market, By Vertical

11.1. Energy Management Systems Market, by Vertical, 2023-2032

11.1.1. Power & Energy

11.1.1.1. Market Revenue and Forecast (2020-2032)

11.1.2. Telecom & IT

11.1.2.1. Market Revenue and Forecast (2020-2032)

11.1.3. Manufacturing

11.1.3.1. Market Revenue and Forecast (2020-2032)

11.1.4. Retail & Offices

11.1.4.1. Market Revenue and Forecast (2020-2032)

11.1.5. Healthcare

11.1.5.1. Market Revenue and Forecast (2020-2032)

11.1.6. Others

11.1.6.1. Market Revenue and Forecast (2020-2032)

Chapter 12. Global Energy Management Systems Market, By End Use

12.1. Energy Management Systems Market, by End Use, 2023-2032

12.1.1. Residential

12.1.1.1. Market Revenue and Forecast (2020-2032)

12.1.2. Commercial

12.1.2.1. Market Revenue and Forecast (2020-2032)

Chapter 13. Global Energy Management Systems Market, Regional Estimates and Trend Forecast

13.1. North America

13.1.1. Market Revenue and Forecast, by Product (2020-2032)

13.1.2. Market Revenue and Forecast, by Component (2020-2032)

13.1.3. Market Revenue and Forecast, by Solution (2020-2032)

13.1.4. Market Revenue and Forecast, by Vertical (2020-2032)

13.1.5. Market Revenue and Forecast, by End Use (2020-2032)

13.1.6. U.S.

13.1.6.1. Market Revenue and Forecast, by Product (2020-2032)

13.1.6.2. Market Revenue and Forecast, by Component (2020-2032)

13.1.6.3. Market Revenue and Forecast, by Solution (2020-2032)

13.1.6.4. Market Revenue and Forecast, by Vertical (2020-2032)

13.1.7. Market Revenue and Forecast, by End Use (2020-2032) 

13.1.8. Rest of North America

13.1.8.1. Market Revenue and Forecast, by Product (2020-2032)

13.1.8.2. Market Revenue and Forecast, by Component (2020-2032)

13.1.8.3. Market Revenue and Forecast, by Solution (2020-2032)

13.1.8.4. Market Revenue and Forecast, by Vertical (2020-2032)

13.1.8.5. Market Revenue and Forecast, by End Use (2020-2032)

13.2. Europe

13.2.1. Market Revenue and Forecast, by Product (2020-2032)

13.2.2. Market Revenue and Forecast, by Component (2020-2032)

13.2.3. Market Revenue and Forecast, by Solution (2020-2032)

13.2.4. Market Revenue and Forecast, by Vertical (2020-2032) 

13.2.5. Market Revenue and Forecast, by End Use (2020-2032) 

13.2.6. UK

13.2.6.1. Market Revenue and Forecast, by Product (2020-2032)

13.2.6.2. Market Revenue and Forecast, by Component (2020-2032)

13.2.6.3. Market Revenue and Forecast, by Solution (2020-2032)

13.2.7. Market Revenue and Forecast, by Vertical (2020-2032) 

13.2.8. Market Revenue and Forecast, by End Use (2020-2032) 

13.2.9. Germany

13.2.9.1. Market Revenue and Forecast, by Product (2020-2032)

13.2.9.2. Market Revenue and Forecast, by Component (2020-2032)

13.2.9.3. Market Revenue and Forecast, by Solution (2020-2032)

13.2.10. Market Revenue and Forecast, by Vertical (2020-2032)

13.2.11. Market Revenue and Forecast, by End Use (2020-2032)

13.2.12. France

13.2.12.1. Market Revenue and Forecast, by Product (2020-2032)

13.2.12.2. Market Revenue and Forecast, by Component (2020-2032)

13.2.12.3. Market Revenue and Forecast, by Solution (2020-2032)

13.2.12.4. Market Revenue and Forecast, by Vertical (2020-2032)

13.2.13. Market Revenue and Forecast, by End Use (2020-2032)

13.2.14. Rest of Europe

13.2.14.1. Market Revenue and Forecast, by Product (2020-2032)

13.2.14.2. Market Revenue and Forecast, by Component (2020-2032)

13.2.14.3. Market Revenue and Forecast, by Solution (2020-2032)

13.2.14.4. Market Revenue and Forecast, by Vertical (2020-2032)

13.2.15. Market Revenue and Forecast, by End Use (2020-2032)

13.3. APAC

13.3.1. Market Revenue and Forecast, by Product (2020-2032)

13.3.2. Market Revenue and Forecast, by Component (2020-2032)

13.3.3. Market Revenue and Forecast, by Solution (2020-2032)

13.3.4. Market Revenue and Forecast, by Vertical (2020-2032)

13.3.5. Market Revenue and Forecast, by End Use (2020-2032)

13.3.6. India

13.3.6.1. Market Revenue and Forecast, by Product (2020-2032)

13.3.6.2. Market Revenue and Forecast, by Component (2020-2032)

13.3.6.3. Market Revenue and Forecast, by Solution (2020-2032)

13.3.6.4. Market Revenue and Forecast, by Vertical (2020-2032)

13.3.7. Market Revenue and Forecast, by End Use (2020-2032)

13.3.8. China

13.3.8.1. Market Revenue and Forecast, by Product (2020-2032)

13.3.8.2. Market Revenue and Forecast, by Component (2020-2032)

13.3.8.3. Market Revenue and Forecast, by Solution (2020-2032)

13.3.8.4. Market Revenue and Forecast, by Vertical (2020-2032)

13.3.9. Market Revenue and Forecast, by End Use (2020-2032)

13.3.10. Japan

13.3.10.1. Market Revenue and Forecast, by Product (2020-2032)

13.3.10.2. Market Revenue and Forecast, by Component (2020-2032)

13.3.10.3. Market Revenue and Forecast, by Solution (2020-2032)

13.3.10.4. Market Revenue and Forecast, by Vertical (2020-2032)

13.3.10.5. Market Revenue and Forecast, by End Use (2020-2032)

13.3.11. Rest of APAC

13.3.11.1. Market Revenue and Forecast, by Product (2020-2032)

13.3.11.2. Market Revenue and Forecast, by Component (2020-2032)

13.3.11.3. Market Revenue and Forecast, by Solution (2020-2032)

13.3.11.4. Market Revenue and Forecast, by Vertical (2020-2032)

13.3.11.5. Market Revenue and Forecast, by End Use (2020-2032)

13.4. MEA

13.4.1. Market Revenue and Forecast, by Product (2020-2032)

13.4.2. Market Revenue and Forecast, by Component (2020-2032)

13.4.3. Market Revenue and Forecast, by Solution (2020-2032)

13.4.4. Market Revenue and Forecast, by Vertical (2020-2032)

13.4.5. Market Revenue and Forecast, by End Use (2020-2032)

13.4.6. GCC

13.4.6.1. Market Revenue and Forecast, by Product (2020-2032)

13.4.6.2. Market Revenue and Forecast, by Component (2020-2032)

13.4.6.3. Market Revenue and Forecast, by Solution (2020-2032)

13.4.6.4. Market Revenue and Forecast, by Vertical (2020-2032)

13.4.7. Market Revenue and Forecast, by End Use (2020-2032)

13.4.8. North Africa

13.4.8.1. Market Revenue and Forecast, by Product (2020-2032)

13.4.8.2. Market Revenue and Forecast, by Component (2020-2032)

13.4.8.3. Market Revenue and Forecast, by Solution (2020-2032)

13.4.8.4. Market Revenue and Forecast, by Vertical (2020-2032)

13.4.9. Market Revenue and Forecast, by End Use (2020-2032)

13.4.10. South Africa

13.4.10.1. Market Revenue and Forecast, by Product (2020-2032)

13.4.10.2. Market Revenue and Forecast, by Component (2020-2032)

13.4.10.3. Market Revenue and Forecast, by Solution (2020-2032)

13.4.10.4. Market Revenue and Forecast, by Vertical (2020-2032)

13.4.10.5. Market Revenue and Forecast, by End Use (2020-2032)

13.4.11. Rest of MEA

13.4.11.1. Market Revenue and Forecast, by Product (2020-2032)

13.4.11.2. Market Revenue and Forecast, by Component (2020-2032)

13.4.11.3. Market Revenue and Forecast, by Solution (2020-2032)

13.4.11.4. Market Revenue and Forecast, by Vertical (2020-2032)

13.4.11.5. Market Revenue and Forecast, by End Use (2020-2032)

13.5. Latin America

13.5.1. Market Revenue and Forecast, by Product (2020-2032)

13.5.2. Market Revenue and Forecast, by Component (2020-2032)

13.5.3. Market Revenue and Forecast, by Solution (2020-2032)

13.5.4. Market Revenue and Forecast, by Vertical (2020-2032)

13.5.5. Market Revenue and Forecast, by End Use (2020-2032)

13.5.6. Brazil

13.5.6.1. Market Revenue and Forecast, by Product (2020-2032)

13.5.6.2. Market Revenue and Forecast, by Component (2020-2032)

13.5.6.3. Market Revenue and Forecast, by Solution (2020-2032)

13.5.6.4. Market Revenue and Forecast, by Vertical (2020-2032)

13.5.7. Market Revenue and Forecast, by End Use (2020-2032)

13.5.8. Rest of LATAM

13.5.8.1. Market Revenue and Forecast, by Product (2020-2032)

13.5.8.2. Market Revenue and Forecast, by Component (2020-2032)

13.5.8.3. Market Revenue and Forecast, by Solution (2020-2032)

13.5.8.4. Market Revenue and Forecast, by Vertical (2020-2032)

13.5.8.5. Market Revenue and Forecast, by End Use (2020-2032)

Chapter 14. Company Profiles

14.1. Siemens AG

14.1.1. Company Overview

14.1.2. Product Offerings

14.1.3. Financial Performance

14.1.4. Recent Initiatives

14.2. Honeywell Inc.

14.2.1. Company Overview

14.2.2. Product Offerings

14.2.3. Financial Performance

14.2.4. Recent Initiatives

14.3. General Electric Company

14.3.1. Company Overview

14.3.2. Product Offerings

14.3.3. Financial Performance

14.3.4. Recent Initiatives

14.4. Emerson Process Management

14.4.1. Company Overview

14.4.2. Product Offerings

14.4.3. Financial Performance

14.4.4. Recent Initiatives

14.5. Elster Group GmbH

14.5.1. Company Overview

14.5.2. Product Offerings

14.5.3. Financial Performance

14.5.4. Recent Initiatives

14.6. Daintree Networks

14.6.1. Company Overview

14.6.2. Product Offerings

14.6.3. Financial Performance

14.6.4. Recent Initiatives

14.7. Schneider Electric

14.7.1. Company Overview

14.7.2. Product Offerings

14.7.3. Financial Performance

14.7.4. Recent Initiatives

14.8. C3 Energy

14.8.1. Company Overview

14.8.2. Product Offerings

14.8.3. Financial Performance

14.8.4. Recent Initiatives

14.9. Daikin Industries

14.9.1. Company Overview

14.9.2. Product Offerings

14.9.3. Financial Performance

14.9.4. Recent Initiatives

14.10. Gridpoint Inc.

14.10.1. Company Overview

14.10.2. Product Offerings

14.10.3. Financial Performance

14.10.4. Recent Initiatives

Chapter 15. Research Methodology

15.1. Primary Research

15.2. Secondary Research

15.3. Assumptions

Chapter 16. Appendix

16.1. About Us

16.2. Glossary of Terms

Proceed To Buy

USD 4500
USD 3800
USD 1900
USD 1200

Customization Offered

  • check-imgCross-segment Market Size and Analysis for Mentioned Segments
  • check-imgAdditional Company Profiles (Upto 5 With No Cost)
  • check-img Additional Countries (Apart From Mentioned Countries)
  • check-img Country/Region-specific Report
  • check-img Go To Market Strategy
  • check-imgRegion Specific Market Dynamics
  • check-imgRegion Level Market Share
  • check-img Import Export Analysis
  • check-imgProduction Analysis
  • check-imgOthers