Enterprise Artificial Intelligence Market Size, Share & Trends Analysis Report By Deployment, By Technology (Natural Language Processing, Computer Vision), By Organization, By End Use- Global Industry Analysis, Share, Growth, Regional Outlook and Forecasts, 2023-2032

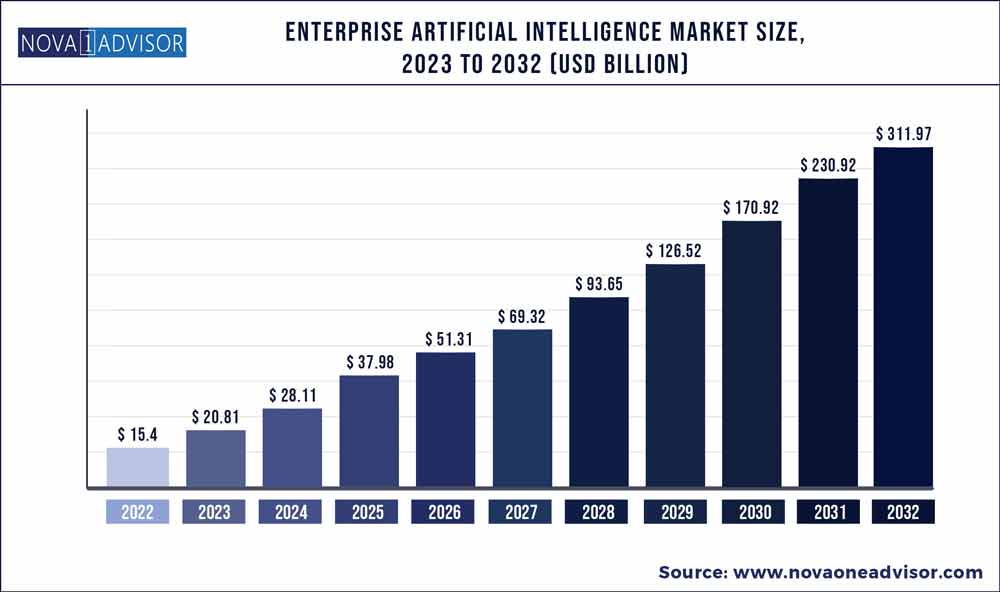
The global enterprise artificial intelligence market size accounted for USD 15.4 billion in 2022 and is estimated to achieve a market size of USD 311.97 billion by 2032 growing at a CAGR of 35.10% from 2023 to 2032.

Enterprise Artificial Intelligence Market Size

Key Pointers:

  • In terms of deployment, the cloud segment held the largest revenue share of 63.9% in 2022 and is projected to maintain its dominance over the forecast period. The adoption of AI technology is growing rapidly however new organizations are facing issues in cleaning large volumes of data, accessing quality data, and training AI systems. The on-premises segment is anticipated to grow at a CAGR of over 31.0% over the forecast period
  • In terms of technology, the Natural Language Processing (NLP) segment held the largest revenue share of 34.9% in 2022 and is projected to maintain its dominance over the forecast period. The growth can be attributed to the increasing demand for voice-based interfaces, chatbots, and virtual assistants. The computer vision segment is expected to register the highest CAGR of over 36.9% over the forecast period
  • In terms of organization, the large enterprises held the largest market share of 64.9% in 2021 and are projected to grow at a CAGR of 32.9% over the forecast period. The demand for AI solutions in this segment is mainly driven by the increasing adoption and awareness of the technology as large enterprises are leveraging AI to boost productivity, increase agility & flexibility, and reduce costs by automating routine tasks. The small and medium enterprises segment is likely to register a CAGR of 39.4% over the forecast period
  • In terms of end-use, the IT & telecom segment dominated the market in 2022 and is projected to grow at a CAGR of 33.9% over the forecast period. The growth can be attributed to rapid urbanization, technological advancement, an increase in investment by startups to provide AI solutions & services, and growing demand for AI in developing countries. The automotive & transportation segment is likely to register the highest CAGR of over 38.0% over the forecast period
  • North America captured the highest market share of 39.1% in 2022 and is expected to retain its position over the forecast period. This can be attributed to the existence of a significant number of artificial intelligence companies and the high adoption rate owing to government measures that stimulate AI usage across various industries in the region
  • Asia Pacific is expected to grow at the highest CAGR of over 37.4% over the forecast period. The growth is primarily due to the increasing skill gaps with a three-pronged approach: upskilling programs, collaborations, and out-tasking usage across the region.
  • In April 2022, Amazon Web Services (AWS) announced service updates that are expected to assist customers in APAC in deploying machine learning at scale, building full stack applications & digital twins quickly, and bringing the cloud nearer to the end-users

Factors such as the growing demand for virtual assistants, chatbots, and robots from numerous enterprises and the increasing need to analyze exponentially growing demand for data sets are driving the demand for artificial intelligence among enterprises. Additionally, the shift of businesses from traditional to digital platforms is fueling the demand for artificial intelligence technology in enterprises worldwide.

The COVID-19 pandemic severely impacted every sector across the world. However, the enterprise artificial intelligence (AI) market experienced growth due to the increased demand for advanced and creative AI-based enterprise products across several sectors such as healthcare, retail, and education during the pandemic. In July 2020, UC San Diego Health, an academic medical center within the University of California, deployed a machine learning-based imaging algorithm that can detect signs of Covid-19 with the help of Amazon Elastic Compute Cloud (Amazon EC2).

The increasing adoption of artificial intelligence in enterprises to enhance customer satisfaction, provide better organization management, and organize data sets are the key factors boosting the demand for artificial intelligence in enterprises. Several AI service providers are innovating and developing new products & services by collaborating with several government institutes, and research & development departments to fulfill the growing demand for AI in the market.

For instance, in May 2022, IBM Corporation announced its strategic collaboration with Mohamed bin Zayed University of Artificial Intelligence (MBZUAI), the first research university of artificial intelligence based in Abu Dhabi, United Arab Emirates (UAE). The collaboration focuses on the advancement of AI fundamental research as well as the acceleration of numerous types of scientific breakthroughs that would enhance the potential of AI to help resolve challenges in the future.

The growing demand for artificial intelligence technology in developing countries offers a significant opportunity for enterprise artificial intelligence service providers. According to a study published in June 2020 by MIT Technology in association with the U.S.-based software company Genesys, AI is offering growth opportunities in the Latin American region as it is helping in tackling numerous critical issues such as food security, unemployment, the smart cities, and natural resources.

The retail and BFSI segments accounted for a significant revenue share with a CAGR of 33.2% and 33.9% respectively over the forecast period. This growth can be attributed to the increasing demand from banking and financial institutions to increase efficiency in business processes, eliminate downtime, and reduce costs on capital investments.

Enterprise Artificial Intelligence Market Report Scope

Report Coverage Details
Market Size in 2023  USD 20.81 billion
Market Size by 2032 USD 311.97  billion
Growth Rate from 2023 to 2032 CAGR of 35.10%
Base Year 2022
Forecast Period 2023 to 2032
Segments Covered Deployment, technology, organization, end-use, region
Key companies profiled Amazon Web Services, Inc.; IBM Corporation; Microsoft Corporation; Oracle Corporation; Intel Corporation; Alphabet; SAP SE; C3.ai, Inc.; DataRobot, Inc.; Hewlett Packard Enterprise; Wipro Limited; NVidia Corporation

Deployment Insights

The cloud segment held the dominant revenue share of 63.6% in 2022 and is expected to register the highest CAGR of over 36.0% during the forecast period. The growth can be attributed to the factors such as increasing investments in technology and the need to reduce costs of on-premise infrastructure maintenance. Cloud deployment enables enterprises to advance their existing system with artificial intelligence-based technology without any reinvestment in their capital cost.

The on-premise segment is projected to grow at a CAGR of 31.9% over the forecast period. The growth of the on-premise segment can be attributed to the increasing concerns over the protection of data related to research, personal information, account transactions, and others.

Technology Insights

Based on technology, the market is segmented into natural language processing (NLP), machine learning, computer vision, speech recognition, and others. The others sub-segment further includes technologies such as planning, scheduling and optimization, robotics, and expert systems. The natural language processing (NLP) segment accounted for the largest revenue share of around 33.0% in 2021 and is projected to grow at a CAGR of 33.2% over the forecast period.

The growth of this segment can be attributed to the increase in the adoption of virtual support services among enterprises and rising investments in AI technology by numerous industry verticals. Moreover, owing to the ability to generate & extract intent from a text in a readable, grammatically correct, and stylistically natural form is driving the demand for NLP technology among enterprises. On the other hand, computer vision is expected to witness the fastest-growing segment and is anticipated to expand at a CAGR of over 36.6% in the coming years. 

End-use Insights

Based on end-use, the market is segmented into media & advertising, retail, BFSI, IT & telecom, healthcare, automotive & transportation, and others. The other sub-segment further comprises academics, manufacturing, and aerospace & defense. The IT & telecom segment accounted for the largest revenue share of USD 2.95 billion in 2021 and is projected to grow at a CAGR of over 32.9% over the forecast period. The growth is attributed to an increase in investment from various IT & telecom startups in AI solutions.

Organization Insights

Based on application, the market is divided into large enterprises and small & medium enterprises. The large enterprises segment held the largest revenue share of 64.9% in 2022 and is projected to retain its position over the forecast period. The growth of this segment can be attributed to the factors such as the increasing need to enhance productivity, reduce costs on infrastructure, and increase flexibility & agility by reducing redundant tasks.

The small and medium enterprises segment is expected to witness the fastest CAGR of 38.9% over the forecast period. The growth of this segment is attributed to the increasing inclination of small and medium enterprises toward AI to ease time-consuming work, improve decision-making, and enhance scalability, productivity, and cost-efficiency.

Regional Insights

North America held the dominant revenue share of 32.1% in 2022 and is anticipated to expand at a CAGR of over 33.9% over the forecast period. Factors such as the existence of leading companies that develop the AI solutions & services, technology infrastructure facilities, and the high number of end-users utilizing data management devices are driving the market in the region.

For instance, in February 2019, the president announced the American AI Initiative as the strategy for advancement in artificial intelligence leadership. Moreover, as part of these initiatives, federal authorities have set standards for the real-world implementation and development of AI-based systems across various industrial sectors.

Asia-Pacific is expected to register the fastest CAGR of 36.9% during the forecast period. The regional growth can be attributed to the increasing adoption of AI and installation of data management platforms which resolve issues such as privacy & security, team coordination, and establishment of moral standards for enterprises. Advancements in AI technology, increasing investment expenditures by governments, and the adoption of innovative technologies across various sectors are acting as the key growth drivers.

For instance, established in 2021 by 663 academicians worldwide, Hong Kong-based, Asia Pacific Artificial Intelligence Association’s (AAIA) principal objective is to empower scientists in the domains of AI and other relative fields. The organization aims to promote AI development and application through academic research and exchanges.

Some of the prominent players in the Enterprise Artificial Intelligence Market include:

  • Amazon Web Services, Inc.
  • IBM Corporation
  • Microsoft Corporation
  • Oracle Corporation
  • Intel Corporation
  • Alphabet Inc.
  • SAP SE
  • C3.ai, Inc.
  • DataRobot, Inc.
  • Hewlett Packard Enterprise Development LP
  • Wipro Limited
  • NVidia Corporation

Enterprise artificial intelligence Market Segmentation

This report forecasts revenue growth at global, regional, and country levels and provides an analysis of the latest industry trends in each of the sub-segments from 2018 to 2032. For this study, Nova one advisor, Inc. has segmented the global Enterprise Artificial Intelligence market

  • By Deployment 
    • Cloud
    • On-premises
  • By Technology 
    • Natural Language Processing (NLP)
    • Machine Learning
    • Computer Vision
    • Speech Recognition
    • Others
  • By Organization 
    • Large Enterprises
    • Small And Medium Enterprises
  • By End-use 
    • Media & Advertising
    • Retail
    • BFSI
    • IT & Telecom
    • Healthcare
    • Automotive & Transportation
    • Others

By Geography

North America

  • U.S.
  • Canada

Europe

  • Germany
  • France
  • United Kingdom
  • Rest of Europe

Asia Pacific

  • China
  • Japan
  • India
  • Southeast Asia
  • Rest of Asia Pacific

Latin America

  • Brazil
  • Rest of Latin America

Middle East & Africa (MEA)

  • GCC
  • North Africa
  • South Africa
  • Rest of Middle East & Africa


Chapter 1. Introduction

                   1.1 Information Procurement

                       1.1.1 Purchased database

                       1.1.2 Nova one advisor’s internal database

                       1.1.3 Secondary sources & third-party perspective

                       1.1.4 Primary research

                   1.2 Information Analysis

                       1.2.1 Data analysis models

                   1.3 Market Formulation and Data Visualization

                   1.4 Data Validation and Publishing

Chapter 2 Executive Summary

                   2.1 Market Outlook

                   2.2 Segment Outlook

Chapter 3 Market Variables, Trends & Scope

                   3.1 Market Lineage Outlook

                       3.1.1 Parent market outlook

                   3.2 Penetration & Growth Prospect Mapping

                   3.3 Market Dynamics

                       3.3.1 Market driver analysis

                           3.3.1.1 Growing demand for virtual assistants, chatbots & robots from numerous enterprises

                           3.3.1.2 Increasing need to analyze exponential growing demand for data set

                       3.3.2 Market restraint/challenges analysis

                           3.3.2.1 Restraining artificial intelligence adoption rate by enterprises

                       3.3.3 Market opportunity analysis

                           3.3.3.1 Increasing investment in AI by developing countries

                   3.4 Porter’s Five Forces Analysis

                   3.5 PEST Analysis

                   3.6 COVID-19 Impact on Enterprise Artificial Intelligence Market

Chapter 4 Enterprise Artificial Intelligence Market: Deployment Estimates & Trend Analysis

                   4.1 Market Size Estimates & Forecasts and Trend Analysis, 2018 - 2032

                   4.2 Deployment Movement Analysis & Market Share, 2021 & 2032

                   4.3 Cloud

                       4.3.1 Market size estimates and forecasts, 2018 - 2032

                   4.4 On-premises

                       4.4.1 Market size estimates and forecasts, 2018 - 2032

Chapter 5 Enterprise Artificial Intelligence Market: Technology Estimates & Trend Analysis

                   5.1 Market Size Estimates & Forecasts and Trend Analysis, 2018 - 2032

                   5.2 Technology Movement Analysis & Market Share, 2021 & 2032

                   5.3 Natural Language Processing (NLP)

                       5.3.1 Market size estimates and forecasts, 2018 - 2032

                   5.4 Machine Learning

                       5.4.1 Market size estimates and forecasts, 2018 - 2032

                   5.5 Computer Vision

                       5.5.1 Market size estimates and forecasts, 2018 - 2032

                   5.6 Speech Recognition

                       5.6.1 Market size estimates and forecasts, 2018 - 2032

                   5.7 Others

                       5.7.1 Market size estimates and forecasts, 2018 - 2032

Chapter 6 Enterprise Artificial Intelligence Market: Organization Estimates & Trend Analysis

                   6.1 Market Size Estimates & Forecasts and Trend Analysis, 2018 - 2032

                   6.2 Organization Movement Analysis & Market Share, 2021 & 2032

                   6.3 Large Enterprises

                       6.3.1 Market size estimates and forecasts, 2018 - 2032

                   6.4 Small and Medium Enterprises

                       6.4.1 Market size estimates and forecasts, 2018 - 2032

Chapter 7 Enterprise Artificial Intelligence Market: End-Use Estimates & Trend Analysis

                   7.1 Market Size Estimates & Forecasts and Trend Analysis, 2018 - 2032

                   7.2 End-Use Type Movement Analysis & Market Share, 2021 & 2032

                   7.3 Media & Advertising

                       7.3.1 Market size estimates and forecasts, 2018 - 2032

                   7.4 Retail

                       7.4.1 Market size estimates and forecasts, 2018 - 2032

                   7.5 BFSI

                       7.5.1 Market size estimates and forecasts, 2018 - 2032

                   7.6 IT & Telecom

                       7.6.1 Market size estimates and forecasts, 2018 - 2032

                   7.7 Healthcare

                       7.7.1 Market size estimates and forecasts, 2018 - 2032

                   7.8 Automotive & Transportation

                       7.8.1 Market size estimates and forecasts, 2018 - 2032

                   7.9 Others

                       7.9.1 Market size estimates and forecasts, 2018 - 2032

Chapter 8 Enterprise Artificial Intelligence Market: Regional Estimates & Trend Analysis

                   8.1 Enterprise Artificial Intelligence Market by Region, 2021 & 2032

                   8.2 Regional Movement Analysis & Market Share, 2021 & 2032

                   8.3 North America

                       8.3.1 North America enterprise artificial intelligence market, 2018 to 2032

                       8.3.2 North America enterprise artificial intelligence, by deployment 2018 - 2032

                       8.3.3 North America enterprise artificial intelligence, by technology 2018 - 2032

                       8.3.4 North America enterprise artificial intelligence, by organization 2018 - 2032

                       8.3.5 North America enterprise artificial intelligence, by end-use 2018 - 2032

                       8.3.6 U.S.

                           8.3.6.1 U.S. enterprise artificial intelligence market, by deployment, 2018 - 2032

                           8.3.6.2 U.S. enterprise artificial intelligence market, by technology 2018 - 2032

                           8.3.6.3 U.S. enterprise artificial intelligence market, by organization 2018 - 2032

                           8.3.6.4 U.S. enterprise artificial intelligence market, by end-use 2018 - 2032

                       8.3.7 Canada

                           8.3.7.1 Canada enterprise artificial intelligence market, by deployment, 2018 - 2032

                           8.3.7.2 Canada enterprise artificial intelligence market, by technology 2018 - 2032

                           8.3.7.3 Canada enterprise artificial intelligence market, by organization size 2018 - 2032

                           8.3.7.4 Canada enterprise artificial intelligence market, by end-use 2018 - 2032

                   8.4 Europe

                       8.4.1 Europe enterprise artificial intelligence market, 2018 - 2032

                       8.4.2 Europe enterprise artificial intelligence, by deployment 2018 - 2032

                       8.4.3 Europe enterprise artificial intelligence, by technology 2018 - 2032

                       8.4.4 Europe enterprise artificial intelligence, by organization 2018 - 2032

                       8.4.5 Europe enterprise artificial intelligence, by end-use 2018 - 2032

                       8.4.6 U.K.

                           8.4.6.1 U.K. enterprise artificial intelligence market, by deployment, 2018 - 2032

                           8.4.6.2 U.K. enterprise artificial intelligence market, by technology 2018 - 2032

                           8.4.6.3 U.K. enterprise artificial intelligence market, by organization 2018 - 2032

                           8.4.6.4 U.K. enterprise artificial intelligence market, by end-use 2018 - 2032

                       8.4.7 Germany

                           8.4.7.1 Germany enterprise artificial intelligence market, by deployment, 2018 - 2032

                           8.4.7.2 Germany enterprise artificial intelligence market, by technology 2018 - 2032

                           8.4.7.3 Germany enterprise artificial intelligence market, by organization 2018 - 2032

                           8.4.7.4 Germany enterprise artificial intelligence market, by end-use 2018 - 2032

                       8.4.8 France

                           8.4.8.1 France enterprise artificial intelligence market, by deployment, 2018 - 2032

                           8.4.8.2 France enterprise artificial intelligence market, by technology 2018 - 2032

                           8.4.8.3 France enterprise artificial intelligence market, by organization 2018 - 2032

                           8.4.8.4 France enterprise artificial intelligence market, by end-use 2018 - 2032

                       8.4.9 Italy

                           8.4.9.1 Italy enterprise artificial intelligence market, by deployment, 2018 - 2032

                           8.4.9.2 Italy enterprise artificial intelligence market, by technology 2018 - 2032

                           8.4.9.3 Italy enterprise artificial intelligence market, by application 2018 - 2032

                           8.4.9.4 Italy enterprise artificial intelligence market, by end-use 2018 - 2032

                       8.4.10 Rest of Europe

                           8.4.10.1 Rest of Europe enterprise artificial intelligence market, by deployment, 2018 - 2032

                           8.4.10.2 Rest of Europe enterprise artificial intelligence market, by technology 2018 - 2032

                           8.4.10.3 Rest of Europe enterprise artificial intelligence market, by organization 2018 - 2032

                           8.4.10.4 Rest of Europe enterprise artificial intelligence market, by end-use 2018 - 2032

                   8.5 Asia Pacific

                       8.5.1 Asia Pacific enterprise artificial intelligence market, 2018 to 2032

                       8.5.2 Asia Pacific enterprise artificial intelligence market, by deployment 2018 - 2032

                       8.5.3 Asia Pacific enterprise artificial intelligence market, by technology 2018 - 2032

                       8.5.4 Asia Pacific enterprise artificial intelligence market, by organization 2018 - 2032

                       8.5.5 Asia Pacific enterprise artificial intelligence market, by end-use 2018 - 2032

                       8.5.6 China

                           8.5.6.1 China enterprise artificial intelligence market, by deployment, 2018 - 2032

                           8.5.6.2 China enterprise artificial intelligence market, by technology 2018 - 2032

                           8.5.6.3 China enterprise artificial intelligence market, by organization 2018 - 2032

                           8.5.6.4 China enterprise artificial intelligence market, by end-use 2018 - 2032

                       8.5.7 India

                           8.5.7.1 India enterprise artificial intelligence market, by deployment, 2018 - 2032

                           8.5.7.2 India enterprise artificial intelligence market, by technology 2018 - 2032

                           8.5.7.3 India enterprise artificial intelligence market, by application 2018 - 2032

                           8.5.7.4 India enterprise artificial intelligence market, by end-use 2018 - 2032

                       8.5.8 Japan

                           8.5.8.1 Japan enterprise artificial intelligence market, by deployment, 2018 - 2032

                           8.5.8.2 Japan enterprise artificial intelligence market, by technology 2018- 2032

                           8.5.8.3 Japan enterprise artificial intelligence market, by organization 2018 - 2032

                           8.5.8.4 Japan enterprise artificial intelligence market, by end-use 2018 - 2032

                       8.5.9 Rest of Asia Pacific

                           8.5.9.1 Rest of Asia Pacific enterprise artificial intelligence market, by deployment, 2018- 2032

                           8.5.9.2 Rest of Asia Pacific enterprise artificial intelligence market, by technology 2018 - 2032

                           8.5.9.3 Rest of Asia Pacific enterprise artificial intelligence market, by organization 2018 - 2032

                           8.5.9.4 Rest of Asia Pacific enterprise artificial intelligence market, by end-use 2018 - 2032

                   8.6 Latin America

                       8.6.1 Latin America enterprise artificial intelligence market, 2018 to 2032

                       8.6.2 Latin America enterprise artificial intelligence market, by deployment 2018 - 2032

                       8.6.3 Latin America enterprise artificial intelligence market, by technology 2018 - 2032

                       8.6.4 Latin America enterprise artificial intelligence market, by organization 2018 - 2032

                       8.6.5 Latin America enterprise artificial intelligence market, by end-use 2018 - 2032

                       8.6.6 Brazil

                           8.6.6.1 Brazil enterprise artificial intelligence market, by deployment, 2018 - 2032

                           8.6.6.2 Brazil enterprise artificial intelligence market, by technology 2018 - 2032

                           8.6.6.3 Brazil enterprise artificial intelligence market, by organization 2018 - 2032

                           8.6.6.4 Brazil enterprise artificial intelligence market, by end-use 2018 - 2032

                       8.6.7 Mexico

                           8.6.7.1 Mexico enterprise artificial intelligence market, by deployment, 2018 - 2032

                           8.6.7.2 Mexico enterprise artificial intelligence market, by technology 2018 - 2032

                           8.6.7.3 Mexico enterprise artificial intelligence market, by application 2018 - 2032

                           8.6.7.4 Mexico enterprise artificial intelligence market, by end-use 2018 - 2032

                       8.6.8 Rest of Latin America

                           8.6.8.1 Rest of Latin America enterprise artificial intelligence market, by deployment, 2018 - 2032

                           8.6.8.2 Rest of Latin America enterprise artificial intelligence market, by technology 2018 - 2032

                           8.6.8.3 Rest of Latin America enterprise artificial intelligence market, by organization 2018- 2032

                           8.6.8.4 Rest of Latin America enterprise artificial intelligence market, by end-use 2018 - 2032

                   8.7 Middle East & Africa (MEA)

                       8.7.1 Middle East & Africa (MEA) enterprise artificial intelligence market, 2018 - 2032

                       8.7.2 Middle East & Africa (MEA) enterprise artificial intelligence market, by deployment 2018 - 2032

                       8.7.3 Middle East & Africa (MEA) enterprise artificial intelligence market by technology 2018 - 2032

                       8.7.4 Middle East & Africa (MEA) enterprise artificial intelligence market, by organization 2018 - 2032

                       8.7.5 Middle East & Africa (MEA) enterprise artificial intelligence market, by end-use 2018 - 2032

Chapter 9 Competitive Analysis

                   9.1 Key Competitor Ranking Analysis, 2021

                   9.2 Recent Developments & Impact Analysis, by Key Market Participants

                   9.3 Company Heat Map/Market Position Analysis

                   9.4 List of Market Players

Chapter 10 Competitive Landscape

                   10.1 Amazon Web Services, Inc.

                       10.1.1 Company overview

                       10.1.2 Financial performance

                       10.1.3 Product benchmarking

                       10.1.4 Strategic initiatives

                   10.2 IBM Corporation

                       10.2.1 Company overview

                       10.2.2 Financial performance

                       10.2.3 Product benchmarking

                       10.2.4 Strategic initiatives

                   10.3 Microsoft Corporation

                       10.3.1 Company overview

                       10.3.2 Financial performance

                       10.3.3 Product benchmarking

                       10.3.4 Strategic initiatives

                   10.4 Oracle Corporation

                       10.4.1 Company overview

                       10.4.2 Financial performance

                       10.4.3 Product benchmarking

                       10.4.4 Strategic initiatives

                   10.5 Intel Corporation

                       10.5.1 Company overview

                       10.5.2 Financial performance

                       10.5.3 Product benchmarking

                       10.5.4 Strategic initiatives

                   10.6 Alphabet Inc.

                       10.6.1 Company overview

                       10.6.2 Financial performance

                       10.6.3 Product benchmarking

                       10.6.4 Strategic initiatives

                   10.7 SAP SE

                       10.7.1 Company overview

                       10.7.2 Financial performance

                       10.7.3 Product benchmarking

                       10.7.4 Strategic initiatives

                   10.8 C3.ai, Inc.

                       10.8.1 Company overview

                       10.8.2 Financial performance

                       10.8.3 Product benchmarking

                       10.8.4 Strategic initiatives

                   10.9 DataRobot, Inc.

                       10.9.1 Company overview

                       10.9.2 Financial performance

                       10.9.3 Product benchmarking

                       10.9.4 Strategic initiatives

                   10.10 Hewlett Packard Enterprise Development LP

                       10.10.1 Company overview

                       10.10.2 Financial performance

                       10.10.3 Product benchmarking

                       10.10.4 Strategic initiatives

                   10.11 Wipro Limited

                       10.11.1 Company overview

                       10.11.2 Financial performance

                       10.11.3 Product benchmarking

                       10.11.4 Strategic initiatives

                   10.12 NVIDIA Corporation

                       10.12.1 Company overview

                       10.12.2 Financial performance

                       10.12.3 Product benchmarking

                       10.12.4 Strategic initiatives

Proceed To Buy

USD 4500
USD 3800
USD 1900
USD 1200

Customization Offered

  • check-imgCross-segment Market Size and Analysis for Mentioned Segments
  • check-imgAdditional Company Profiles (Upto 5 With No Cost)
  • check-img Additional Countries (Apart From Mentioned Countries)
  • check-img Country/Region-specific Report
  • check-img Go To Market Strategy
  • check-imgRegion Specific Market Dynamics
  • check-imgRegion Level Market Share
  • check-img Import Export Analysis
  • check-imgProduction Analysis
  • check-imgOthers