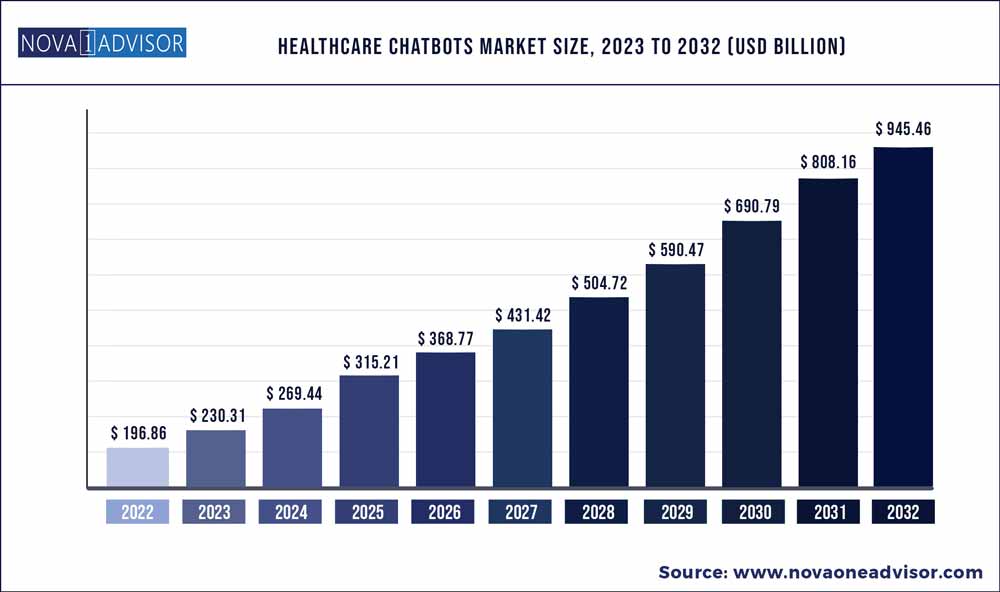
The global healthcare chatbots market size was exhibited at USD 196.86 billion in 2022 and is projected to hit around USD 945.46 billion by 2032, growing at a CAGR of 16.99% during the forecast period 2023 to 2032.
Key Points:
- By geography, the North American region generated more than 60% of the revenue share in 2022
- By deployment, the cloud-based model segment held the largest share of around 75% in 2022 and was the fastest-growing category from 2023 to 2032.
- By component, the software segment dominates the demand for healthcare chatbots globally.
- By application, the symptoms check segment held the highest market share.
- By end-user, the patient segment is the primary user and held the major market share.
Growing patient waiting time and a lack of effective patient engagement, rising use of healthcare chatbots, healthcare chatbot's increasing demand as a result of increasing demand for virtual health assistance, and growing numbers of collaborative efforts between healthcare providers are all contributing to the growing demand for virtual health assistance, which is a crucial factor driving the market growth. Additionally, throughout the forecast years, the market for healthcare chatbots would see new opportunities due to the growth of chatbots focused on social networking platforms and the development of cloud-based models.
Intelligent device use and expanding internet availability are significant industry drivers. A lack of experience in chatbot development, in addition to growing ignorance and misunderstandings, will further hamper the expansion of the Healthcare Chatbot Market during the forecast period. Rising worries about data privacy are the primary reasons obstructing the market growth. As a result of recent advancements in digital technology, numerous healthcare organizations have started utilizing various digital marketing strategies. The market for healthcare chatbots is likely to increase since phone and messaging services, a component of chatbots, were incorporated into these plans.
Medical chatbots are helpful for the economy, but there are obstacles to their global market expansion. The user's right to privacy is the most crucial factor, and some patients might be reluctant to divulge personal information to chatbots. The lack of trained healthcare IT employees is another issue that has led to cyberattacks. These elements are inhibiting the growth of healthcare chatbots in the global market. Business growth is, however, constrained by problems like a lack of experience, limited interaction options, and data privacy worries.
Report Scope of the Healthcare Chatbots Market
| Report Coverage |
Details |
| Market Size in 2023 |
USD 230.31 billion |
| Market Size by 2032 |
USD 945.46 billion |
| Growth Rate from 2023 to 2032 |
CAGR of 16.99% |
| Base Year |
2022 |
| Forecast Period |
2023 to 2032 |
| Segments Covered |
By Component, By Application, By Deployment, By End-User region |
| Key companies profiled |
Anboto, Sensely, Inc., HealthTap, Inc., Infermedica, Buoy Health, Inc., Ada Health GmbH, Babylon, Baidu, Inc., Woebot, GYANT.COM, Inc., PACT Care BV, Your.MD Ltd, Creative Virtual, Next IT Corp., CX Company, Inbenta Global, Synthetix Ltd. |
| Regions Covered |
North America, Europe, Asia-Pacific, Latin America and Middle East & Africa |
Market Dynamics
Drivers
The rise in the number of smartphone users worldwide and increasing internet penetration among the masses are the major factors driving the growth of the healthcare chatbots market. There is a rising need for chatbots to lessen the burden on healthcare infrastructure. These chatbots can perform wide functions from grievance redressal to medical guidance, and therefore have huge market potential.
With increasing technological advancements in the healthcare sector, healthcare chatbots are becoming more user-friendly and informative. Moreover, with increasing literacy rate and technological adaptation people's trust towards virtual assistants is also increasing. Therefore, it will bring a positive impact on the market growth of the healthcare chatbots.
Restraints
Lack of awareness and misconceptions about chatbots is the major growth restraining factor for the healthcare chatbots market. Moreover, the requirement of technological knowledge for operation deprives a large population who are not technology friendly of its benefits. Furthermore, a large segment of the global population is still beyond the reach of smartphones and affordable Internet services which is a major hindrance to the market.
Data privacy and security are still a matter of huge concern for the global internet users which will affect the market of healthcare chatbots. The other concerns such as less user-friendliness and limited use are too growth restricting factors that will improve with technological advancements.
Technology Analysis
Healthcare chatbots are interactive online query redressal systems for patients and health enthusiasts. Chatbots are interactive software applications that interact with a user on a text messaging or text to speech platform using artificial intelligence or language processors. These chatbots are nowadays utilized in different sectors for functions such as customer service, information gathering, and request routing, etc.
The type of chatbots can range from basic limited bots to complex bots that use AI to respond to users' queries. The basic bots work on a predefined input-output system until the query is addressed. Whereas complex bots utilize artificial intelligence tools to understand a user's keywords and respond to them accordingly.
Healthcare chatbots Market Segmentation
| By Component |
By Application |
By Deployment |
By End-User |
|
Service
Software
Others
|
Symptoms Check
Appointment Scheduling and Monitoring
Medical and Drug Information Assistance
Others
|
On-premise Model
Cloud-based Model
|
Healthcare payers
Healthcare providers
Patients
Other
|

