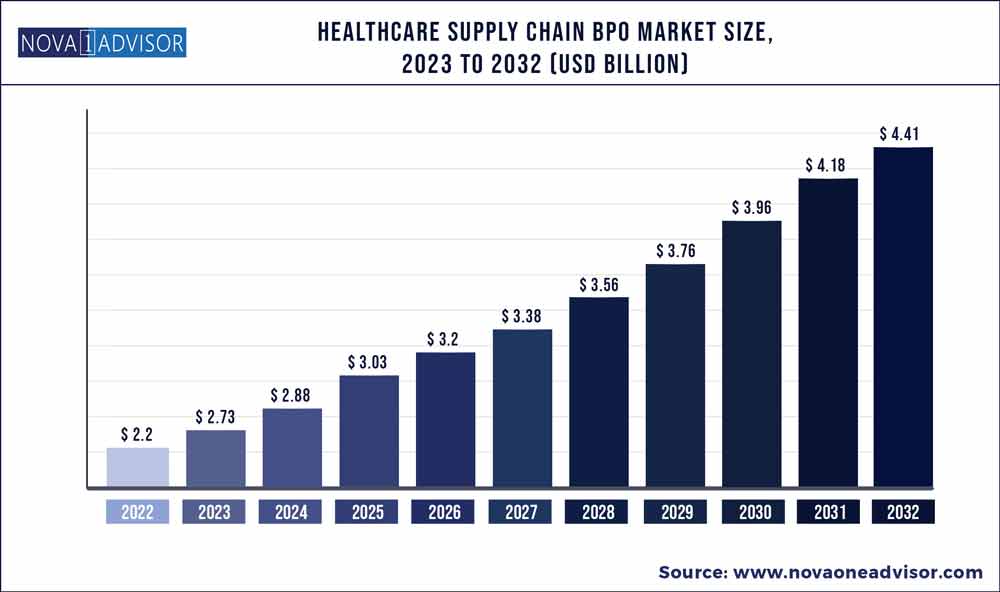
The global healthcare supply chain BPO market size was exhibited at USD 2.2 billion in 2022 and is projected to hit around USD 4.41 billion by 2032, growing at a CAGR of 6.8% during the forecast period 2023 to 2032.
Key Pointers:
The outsourcing of healthcare supply chain management services to third-party service providers is known as the healthcare supply chain business process outsourcing (BPO). The growth of this market is attributed to the rise in the need for cost-effective operations and growth in demand for advanced supply chain management (SCM) practices.
Rising demand for an efficient inventory management system and increasing efforts of healthcare providers to reduce costs and improve the quality of the supply chain are anticipated to propel the market growth.
Healthcare supply chain business process outsourcing (BPO) is a strategy adopted by the healthcare industries to increase their business by outsourcing their ancillary functions to third party organizations in order to reduce cost, transaction, and active processing. The major factors fueling the market growth are rising pressure to decrease the healthcare delivery cost, increasing prevalence of cardiovascular diseases, and the growing presence of experienced healthcare BPO service providers. With the increasing demand for healthcare, the outsourcing services are expected to provide various opportunities for the healthcare IT industries to poach on. Additionally, an increasing number of people pursuing insurance and consolidation of the healthcare system are the major factors fueling market growth.
North America held the largest share of 54.2% in 2022 and is expected to maintain its lead over the forecast period. Increasing adoption of offshore healthcare supply chain business process outsourcing and raising awareness with regards to cost implications are expected to drive the market in the region. In addition, increased technological development in the pharmaceutical sector and growing demand for healthcare IT services in the region are anticipated to propel market growth in the region.
Healthcare supply chain BPO Market Segmentation
| By Payer Service | By End-user |
|
Order Management Inventory Management Transport Management Manufacturing Management Sustainability Services
|
Biotechnology and Pharmaceutical Companies Academic and Government Research Institutes Others
|
Healthcare supply chain BPO Market Key Players And Regions
| Companies Profiled | Regions Covered |
|
Firstsource Solutions Gebbs Healthcare Solutions WNS (Holdings) Xerox Corporation |
North America Europe Asia-Pacific Latin America Middle East & Africa (MEA)
|
Healthcare Supply Chain BPO Market
