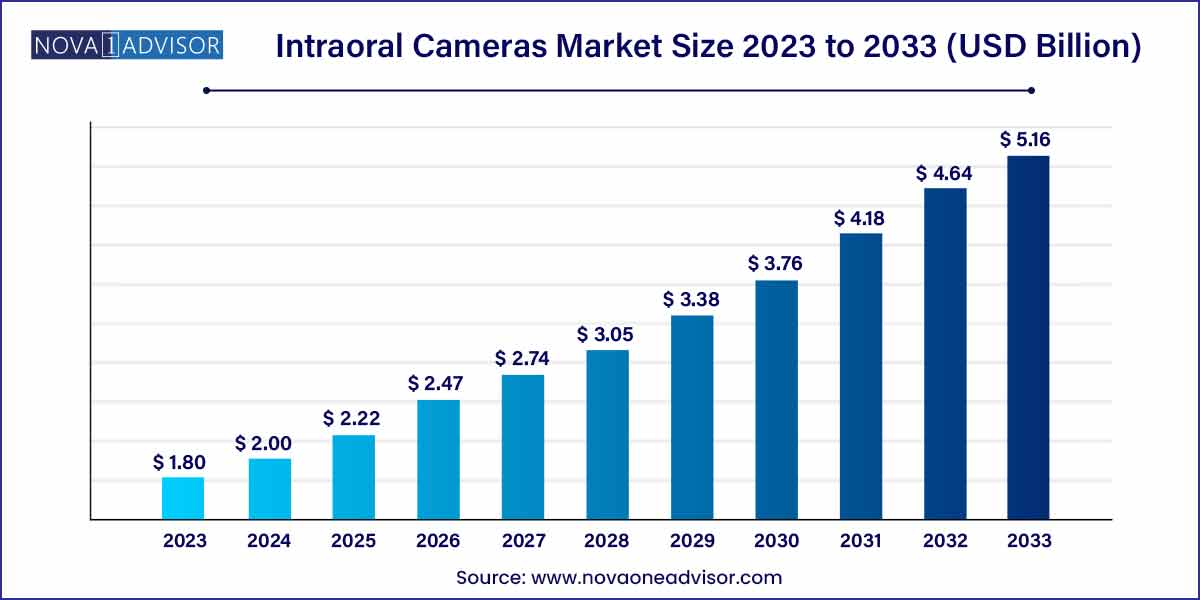
The global intraoral cameras size was exhibited at USD 1.80 billion in 2023 and is projected to hit around USD 5.16 billion by 2033, growing at a CAGR of 11.1% during the forecast period 2024 to 2033.

Key Takeaways:
- The intraoral wand segment dominated the market for intraoral cameras and held the largest revenue share of 71.5% in 2023.
- The fiber optic camera segment dominated the market for intraoral cameras and accounted for the largest revenue share of 37.4% in 2023.
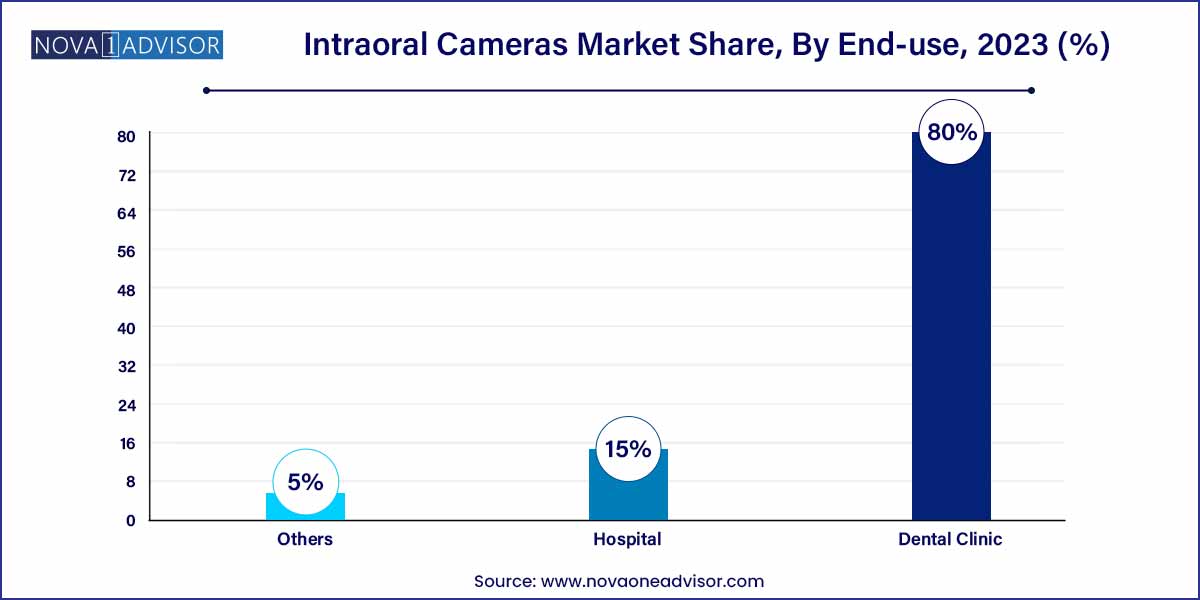
- The dental clinics segment dominated the market for intraoral cameras and held the largest revenue share of 80.0% in 2023.
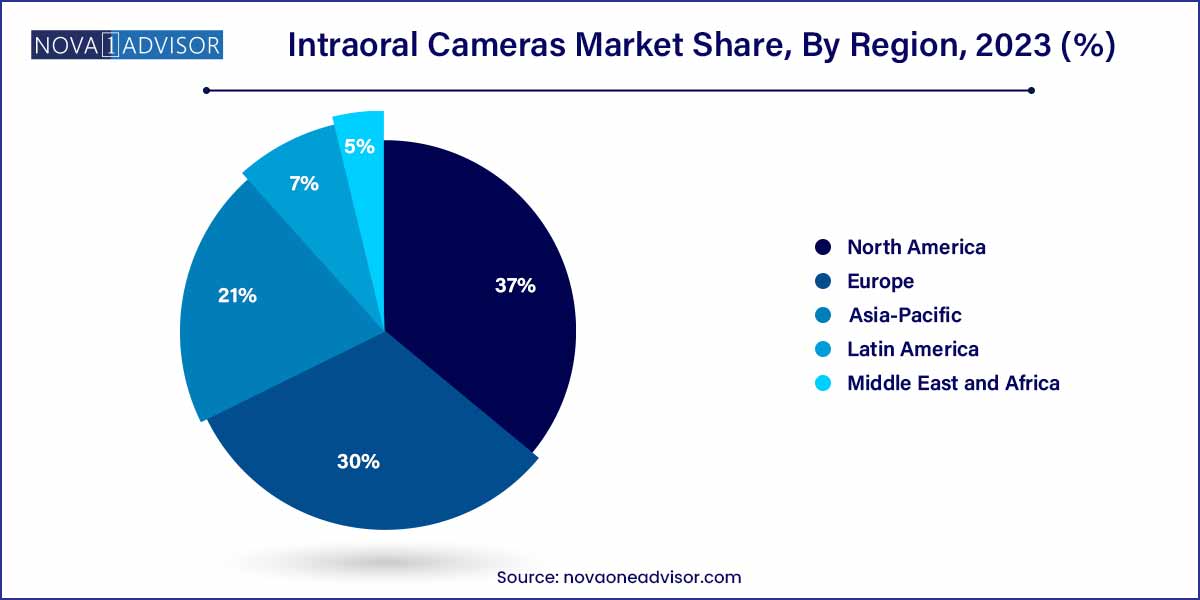
- North America dominated the intraoral camera market and accounted for the largest revenue share of 37.0% in 2023.
Market Overview
The intraoral cameras market has emerged as a pivotal segment within the broader dental imaging industry, offering dentists a modern, efficient way to capture detailed images inside a patient’s mouth. As dental care becomes more patient-centric, the demand for technologies that enhance diagnostic accuracy and patient communication has grown exponentially. Intraoral cameras (IOCs) fit seamlessly into this paradigm shift by providing high-resolution, real-time imaging capabilities.
Technological advancements have driven the miniaturization, affordability, and accessibility of intraoral cameras. Additionally, the increasing emphasis on cosmetic dentistry, preventive care, and early diagnosis of dental disorders has substantially boosted market growth. The growing awareness about oral hygiene, supported by government initiatives and educational campaigns, has also expanded the potential consumer base for intraoral imaging devices.
The global intraoral cameras market is characterized by a robust competitive landscape with numerous players offering innovative solutions. Integration with electronic health records (EHRs), cloud-based data storage, and the increasing preference for wireless and USB-based devices have further spurred market expansion. As the dental industry continues its march toward digitalization, intraoral cameras are becoming indispensable tools in dental practices worldwide.
Major Trends in the Market
-
Wireless Technology Integration: Modern intraoral cameras are increasingly adopting wireless technologies, allowing for greater flexibility, ease of use, and faster integration into dental workflows.
-
Cloud Storage Solutions: Dental practices are leveraging cloud platforms to store, access, and share intraoral images, improving efficiency and enabling remote consultations.
-
AI-Assisted Diagnostics: Some intraoral camera systems are beginning to integrate artificial intelligence to assist with real-time diagnosis, enhancing the speed and accuracy of dental assessments.
-
Ergonomic and Compact Designs: Manufacturers are focusing on producing lightweight, ergonomic devices that minimize operator fatigue and increase maneuverability within the oral cavity.
-
Increased Focus on Cosmetic Dentistry: Rising patient demand for cosmetic dental procedures is boosting the adoption of intraoral cameras to assist in treatment planning and marketing.
-
Tele-dentistry Expansion: The COVID-19 pandemic accelerated the adoption of remote consultations, with intraoral cameras playing a critical role in facilitating virtual dental examinations.
-
Portable and USB-Based Cameras: There is growing demand for portable and easy-to-use USB intraoral cameras, especially among small dental clinics and solo practitioners.
-
3D Imaging Capabilities: Some advanced intraoral cameras are integrating 3D imaging technologies, offering even greater detail for complex dental procedures.
Intraoral Cameras Market Report Scope
| Report Coverage |
Details |
| Market Size in 2024 |
USD 1.80 Bllion |
| Market Size by 2033 |
USD 5.16 Billion |
| Growth Rate From 2024 to 2033 |
CAGR of 11.1% |
| Base Year |
2023 |
| Forecast Period |
2024-2033 |
| Segments Covered |
Product, Technology, End-use, Region |
| Market Analysis (Terms Used) |
Value (US$ Million/Billion) or (Volume/Units) |
| Regional Scope |
North America; Europe; Asia Pacific; Central and South America; the Middle East and Africa |
| Key Companies Profiled |
Danaher Corporation; Sirona Dental System; Carestream Health; Gendex; Owandy Radiology; TPC Advanced Technology Inc.; Digital Doc LLC; DEXIX; Prodent. |
Driver: Rising Demand for Advanced Dental Diagnostics
One of the strongest drivers of the intraoral cameras market is the rising demand for advanced dental diagnostics. As dental diseases become more prevalent globally, early detection and accurate diagnosis are paramount. Intraoral cameras enable dentists to visualize cavities, fractures, lesions, and plaque build-up with exceptional clarity. By capturing and projecting these images on a screen, they not only aid dentists in precise treatment planning but also enhance patient understanding and acceptance of proposed treatments. For instance, a dentist showing a patient a magnified image of a developing cavity can significantly improve treatment adherence. This trend is particularly evident in aging populations, where dental issues are more complex and require high-resolution imaging for comprehensive care.
Restraint: High Initial Cost
Despite their numerous benefits, the high initial cost of intraoral cameras remains a significant restraint. Small and mid-sized dental practices, particularly in emerging economies, may find it challenging to allocate budgets for advanced imaging tools. Additionally, the cost of maintenance, software integration, and periodic upgrades further adds to the total cost of ownership. While larger dental chains and specialty clinics can absorb these expenses, independent practitioners may delay adoption. Consequently, cost sensitivity among potential buyers could impede market penetration, particularly in cost-conscious regions where price competitiveness often outweighs advanced feature offerings.
Opportunity: Growing Penetration in Emerging Markets
An exciting opportunity for the intraoral cameras market lies in the expanding healthcare infrastructure and rising awareness of oral health in emerging markets like India, China, Brazil, and South Africa. As disposable incomes rise and urbanization progresses, more individuals seek dental services not just for medical reasons but also for cosmetic improvements. Governments and NGOs are increasingly promoting oral hygiene through public health initiatives, creating fertile ground for the introduction of advanced diagnostic tools like intraoral cameras. Moreover, the increasing number of dental colleges and training institutes in these regions ensures that new generations of dentists are familiar with and favor the use of digital imaging solutions, fueling future demand.
Product Insights
In the product segment, the intraoral wand dominated the market in 2024, primarily due to its ergonomic design, lightweight structure, and ease of maneuverability within the oral cavity. Intraoral wands are highly preferred in daily dental examinations, offering the flexibility to capture images from multiple angles with minimal discomfort to the patient. Their straightforward design and affordability compared to single-lens reflex cameras make them a go-to option for a broad range of dental practices, from general dentistry to orthodontics. Leading dental chains have standardized the use of intraoral wands across their clinics, further boosting their dominance in the market.
On the other hand, the single-lens reflex (SLR) cameras segment is projected to witness the fastest growth during the forecast period. SLR intraoral cameras provide exceptionally high-resolution images, often necessary for specialized dental procedures like orthodontics, periodontics, and cosmetic surgeries. As demand for personalized and aesthetically driven dental procedures rises, so does the need for sophisticated imaging tools like SLR intraoral cameras. The increasing preference for premium dental care services among urban populations globally is anticipated to significantly drive the adoption of SLR cameras in coming years.
Technology Insights
Among the technology segment, USB cameras dominated the market in 2024, owing to their affordability, plug-and-play capability, and compatibility with most dental software systems. USB intraoral cameras are especially popular among small to medium-sized dental clinics that require effective yet budget-conscious solutions. Their ability to quickly integrate with existing dental setups without significant technical overhauls further strengthens their market hold.
Meanwhile, wireless cameras are expected to register the fastest growth rate over the forecast period. Wireless intraoral cameras provide greater mobility and eliminate the clutter associated with wired connections, improving the overall patient experience and operational efficiency. As more clinics invest in upgrading their infrastructure to smart dental practices, the demand for wireless intraoral cameras is set to surge. Innovations in battery life and data security are also making wireless models more appealing to technologically progressive dental clinics.
End-use Insights
In terms of end-use, dental clinics held the largest market share in 2023. This dominance stems from the fact that dental clinics represent the primary point of care for oral health services globally. Solo practitioners, group practices, and specialized dental clinics heavily rely on intraoral cameras to provide comprehensive consultations, bolster patient trust, and streamline treatment workflows. The ability of intraoral cameras to enhance case acceptance rates through better patient education makes them an essential tool in modern dental practices.

Hospitals, however, are poised to witness the fastest growth in the coming years. As multi-specialty hospitals expand their dental departments to offer a broader range of services under one roof, the adoption of advanced diagnostic tools like intraoral cameras becomes essential. Furthermore, the rising trend of dental tourism, especially in countries like India, Thailand, and Hungary, is pushing hospitals to invest in state-of-the-art dental equipment to attract international patients.
Regional Insights
North America emerged as the dominant region in the intraoral cameras market in 2024, driven by a combination of advanced healthcare infrastructure, high dental care awareness, and substantial investments in dental technology innovations. The U.S., in particular, boasts a highly developed dental services market with a strong emphasis on cosmetic dentistry, preventive care, and digital recordkeeping. Favorable reimbursement policies for diagnostic procedures, along with the high adoption rate of technologically advanced dental devices, bolster North America's leadership position. Major market players like Dentsply Sirona and Carestream Dental have strong distribution networks in the region, further strengthening its dominance.

Asia-Pacific is anticipated to record the fastest growth rate over the forecast period. The region's burgeoning middle class, increasing healthcare expenditures, and heightened awareness about dental health are key growth drivers. Countries such as China, India, and South Korea are witnessing rapid expansion in their dental care markets, fueled by both government-led public health initiatives and private sector investments. Furthermore, the rising demand for cosmetic dentistry among younger demographics and medical tourism is spurring the adoption of intraoral cameras in the region. Local manufacturers offering cost-effective intraoral camera solutions are also playing a critical role in market expansion.
Some of the prominent players in the Intraoral cameras include:
- Danaher Corporation
- Sirona Dental System
- Carestream Health
- Gendex
- Owandy Radiology
- TPC Advanced Technology Inc.
- Digital Doc LLC
- DEXIX
- Prodent
Recent Developments
-
January 2025: Dentsply Sirona announced the launch of a new wireless intraoral camera, "Primescan Connect Cam," enhancing image quality and workflow integration with dental practice management software.
-
November 2024: MouthWatch LLC expanded its "TeleDent" platform with improved compatibility for its intraoral cameras, aiming to strengthen its position in the tele-dentistry market.
-
August 2024: Carestream Dental partnered with Planmeca Oy to offer an integrated imaging solution, combining intraoral cameras with CAD/CAM dental systems.
-
May 2024: Acteon Group launched the "Sopro 717 First Wi-Fi," an upgraded wireless intraoral camera designed for improved imaging clarity and enhanced battery life, targeting premium dental clinics.
Segments Covered in the Report
This report forecasts revenue growth at global, regional, and country levels and provides an analysis of the latest industry trends in each of the sub-segments from 2021 to 2033. For this study, Nova one advisor, Inc. has segmented the global intraoral cameras.
Product
- Intraoral Wand
- Single-Lens Reflex
Technology
- USB Camera
- Fiber Optic Camera
- Wireless Cameras
- Others
End-use
- Hospital
- Dental Clinic
- Others
By Region
- North America
- Europe
- Asia-Pacific
- Latin America
- Middle East & Africa (MEA)


