Lyophilized Injectable Drugs Market Size By Drug (Anti-infective, Anti-neoplastic, Anticoagulant, Hormones, Antiarrhythmic), By Indication (Autoimmune Diseases, Respiratory Diseases, Gastrointestinal Disorders, Oncology, Cardiovascular Diseases, Infectious Diseases, Metabolic Disorders), By Delivery (Prefilled Diluent Syringes, Multi-step Devices), By Packaging (Vials, Cartridges, Prefilled Devices), By Distribution Channel (Hospital Pharmacy, Retail Pharmacy, Online Pharmacy)- Global Industry Analysis, Share, Growth, Regional Outlook and Forecasts, 2023-2032

The global iyophilized injectable drugs market size was exhibited at USD 285.89 billion in 2022 and is projected to hit around USD 1050.59 billion by 2032, growing at a CAGR of 13.9% during the forecast period 2023 to 2032.
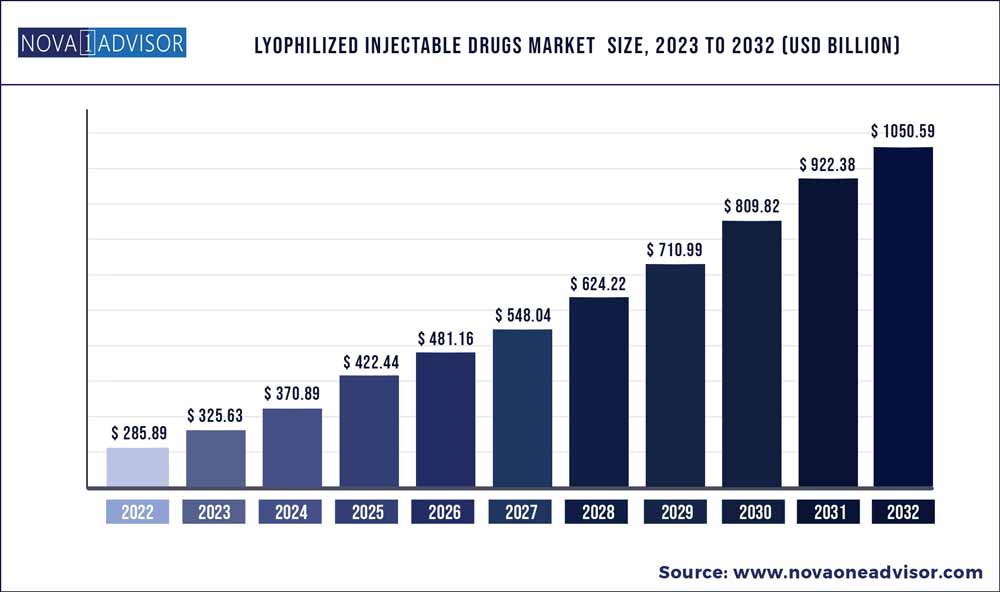
iyophilized injectable drugs market

Key Pointers:

  • North America lyophilized injectable drugs market held over 48% revenue share in 2022.
  • Antiarrhythmic drugs segment accounted for over USD 20 billion in 2022
  • Lyophilized injectable drugs market from respiratory diseases indication is anticipated to witness 13% CAGR between 2023-2032
  • Lyophilized injectable drugs market from prefilled diluent syringes segment held more than 30% business share in 2022.
  • Online pharmacy segment was more than USD 35 billion in 2022.

Lyophilized Injectable Drugs Market Report Scope

The report identifies the ongoing product approvals for critical drugs as a key factor driving the industry growth, with development of vast product pipelines across developed nations. Also, the emergence of novel diseases and the lack of treatment for several terminal illnesses has encouraged clinical studies. Various organizations are working towards securing approval for the use of lyophilized injectable drugs in cancer treatment.

Antiarrhythmic drugs segment accounted for over USD 20 billion in 2022. Rising demand for these drugs can be attributed to the increasing prevalence of cardiac disorders worldwide. In addition to this, this class of drugs is also heavily used in intensive care units (ICUs), which will augment the industry forecast.

Lyophilized injectable drugs market from respiratory diseases indication is anticipated to witness 13% CAGR between 2023-2032. The incidences of respiratory disorders have increased at a notable pace over the last decade on account of urbanization, rising pollution levels, changing lifestyle habits, excessive consumption of tobacco, and a constantly growing geriatric population.

Lyophilized injectable drugs market from prefilled diluent syringes segment held more than 30% business share in 2022. Prefilled syringes have gained considerable traction owing to several advantageous features such as improved handling and convenience, accelerating the use of drugs in home-care settings. These syringes help extend the shelf life of drugs without hampering their potency, which is expected to foster a sustainable rise in demand for lyophilized injectable medications.

Online pharmacy segment was more than USD 35 billion in 2022. A steady shift from pharmacy stores to e-commerce websites, notably driven by the emergence of the COVID-19 pandemic will foster the development of online platforms. Online or e-commerce shopping has multiple benefits such as easy and convenient purchases, discount offers, and availability of innovative products.

North America lyophilized injectable drugs market held over 48% revenue share in 2022. Rising cases of chronic diseases across the region, robust healthcare infrastructure and favorable reimbursement framework will bolster the industry expansion across the U.S. and Canada. Growing consumption of processed food, alcohol, and unhealthy lifestyle habits have contributed to rapid growth in the number of obese and diabetic adults. Continuous rise in healthcare R&D expenditure will offer significant opportunities for drug makers in the region.

Lyophilized Injectable Drugs Market Segmentation

By Drug By Indication By Delivery By Packaging By Distribution Channel

Anti-infective

Anti-neoplastic

Anticoagulant

Hormones

Antiarrhythmic

Others

Autoimmune diseases

Respiratory diseases

Gastrointestinal disorders

Oncology

Cardiovascular diseases

Infectious diseases

Metabolic disorders

Others

Prefilled diluent syringes

Multi-step devices

Vials

Cartridges

Prefilled devices

Hospital pharmacy

Retail pharmacy

Online pharmacy


Lyophilized Injectable Drugs Market Key Players And Regions

Companies Profiled Regions Covered

Bristol Myers Squibb

Gilead Sciences, Inc

F. Hoffmann-La Roche Ltd

Novo Nordisk A/S 

Sanofi

Aurobindo Pharmaceuticals

Fresenius SE & Co. KGaA (Fresenius Kabi)

Merck & Co., Inc

Zydus Group 

Vetter Pharma 

Johnson & Johnson Services, Inc

Takeda Pharmaceutical Company Limited 

Cipla Ltd.

North America

Europe

Asia-Pacific

Latin America

Middle East & Africa (MEA)


Frequently Asked Questions

The global Lyophilized Injectable Drugs market size was exhibited at USD 285.89 billion in 2022 and is projected to hit around USD 1050.59 billion by 2032

The global Lyophilized Injectable Drugs market is growing at a compound annual growth rate (CAGR) of 11.9% from 2023 to 2032.

A consistent rise in geriatric population, which is prone to cancer and other chronic diseases, is expanding the lyophilized injectable drugs market in Europe.

Bristol Myers Squibb, Novo Nordisk A/S, Sanofi, Merck & Co., Inc, Zydus Group, Vetter Pharma, and Takeda Pharmaceutical Company Limited are some of the leading companies in global lyophilized injectable drugs market.

Chapter 1. Introduction

1.1    Market definitions

1.2    Base estimates and working

1.2.1    North America

1.2.2    Europe

1.2.3    Asia pacific

1.2.4    Latin America

1.2.5    MEA

1.3    Forecast calculations

1.4    Data validation

1.5    Data sources

1.5.1    Secondary

1.5.1.1   Paid sources

1.5.1.2   Public sources

1.5.2    Primary

Chapter 2   Executive Summary

2.1    Lyophilized injectable drugs industry 360° synopsis, 2018 - 2032

2.1.1    Business trends

2.1.2    Drug type trends

2.1.3    Indication trends

2.1.4    Type of delivery trends

2.1.5    Packaging trends

2.1.6    Distribution channel trends

2.1.7    Regional trends

Chapter 3   Lyophilized Injectable Drugs Industry Insights

3.1    Industry segmentation

3.2    Industry landscape, 2018 - 2032

3.3    Industry impact forces

3.3.1    Growth drivers

3.3.1.1   Increasing prevalence of chronic diseases globally

3.3.1.2   Growing research and development activities in the industry

3.3.1.3   Increasing number of product approvals for lyophilized injectable drugs

3.3.1.4   Technological advancements in lyophilized injectable drugs delivery system

3.3.2    Industry pitfalls & challenges

3.3.2.1   Substantial number of product recalls of lyophilized drugs

3.3.2.2   High costs associated with the manufacturing process

3.4    Growth potential analysis

3.4.1    By drug type

3.4.2    By indication

3.4.3    By type of delivery

3.4.4    By packaging

3.4.5    By distribution channel

3.5    COVID- 19 impact analysis

3.6    Patent landscape, 2021

3.6.1    Top 10 patented lyophilized injectable drugs

3.7    Regulatory landscape

3.7.1    U.S.

3.7.2    Europe

3.8    Porter's analysis

3.8.1    Bargaining power of suppliers

3.8.2    Bargaining power of buyers

3.8.3    Threat of new entrants

3.8.4    Threat of substitutes

3.8.5    Industry rivalry

3.9    Competitive landscape, 2021

3.9.1    F. Hoffmann-La Roche Ltd

3.9.2    Merck & Co., Inc

3.9.3    Fresenius SE & Co. KGaA (Fresenius Kabi)

3.9.4    Company matrix analysis, 2021

3.10    PESTLE analysis

Chapter 4   Lyophilized Injectable Drugs Market, By Drug Type

4.1    Key segment trends

4.2    Anti-infective

4.2.1    Market size, by region, 2018 - 2032

4.3    Anti-neoplastic

4.3.1    Market size, by region, 2018 - 2032

4.4    Anticoagulant

4.4.1    Market size, by region, 2018 - 2032

4.5    Hormones

4.5.1    Market size, by region, 2018 - 2032

4.6    Antiarrhythmic

4.6.1    Market size, by region, 2018 - 2032

4.7    Others

4.7.1    Market size, by region, 2018 - 2032

Chapter 5   Lyophilized Injectable Drugs Market, By Indication

5.1    Key segment trends

5.2    Autoimmune diseases

5.2.1    Market size, by region, 2018 - 2032

5.3    Respiratory diseases

5.3.1    Market size, by region, 2018 - 2032

5.4    Gastrointestinal disorders

5.4.1    Market size, by region, 2018 - 2032

5.5    Oncology

5.5.1    Market size, by region, 2018 - 2032

5.6    Cardiovascular diseases

5.6.1    Market size, by region, 2018 - 2032

5.7    Infectious diseases

5.7.1    Market size, by region, 2018 - 2032

5.8    Metabolic disorders

5.8.1    Market size, by region, 2018 - 2032

5.9    Others

5.9.1    Market size, by region, 2018 - 2032

Chapter 6   Lyophilized Injectable Drugs Market, By Type of Delivery

6.1    Key segment trends

6.2    Prefilled diluent syringes

6.2.1    Market size, by region, 2018 - 2032

6.3    Multi-step devices

6.3.1    Market size, by region, 2018 - 2032

Chapter 7   Lyophilized Injectable Drugs Market, By Packaging

7.1    Key segment trends

7.2    Vials

7.2.1    Market size, by region, 2018 - 2032

7.3    Cartridges

7.3.1    Market size, by region, 2018 - 2032

7.4    Prefilled devices

7.4.1    Market size, by region, 2018 - 2032

Chapter 8   Lyophilized Injectable Drugs Market, By Distribution Channel

8.1    Key segment trends

8.2    Hospital pharmacy

8.2.1    Market size, by region, 2018 - 2032

8.3    Retail pharmacy

8.3.1    Market size, by region, 2018 - 2032

8.4    Online pharmacy

8.4.1    Market size, by region, 2018 - 2032

Chapter 9   Lyophilized Injectable Drugs Market, By Region

9.1    Key regional trends

9.2    North America

9.2.1    Market size, by country, 2018 - 2032

9.2.2    Market size, by drug type, 2018 - 2032

9.2.3    Market size, by indication, 2018 - 2032

9.2.4    Market size, by type of delivery, 2018 - 2032

9.2.5    Market size, by packaging, 2018 - 2032

9.2.6    Market size, by distribution channel, 2018 - 2032

9.2.7    U.S.

9.2.7.1   Market size, by drug type, 2018 - 2032

9.2.7.2   Market size, by indication, 2018 - 2032

9.2.7.3   Market size, by type of delivery, 2018 - 2032

9.2.7.4   Market size, by packaging, 2018 - 2032

9.2.7.5   Market size, by distribution channel, 2018 - 2032

9.2.8    Canada

9.2.8.1   Market size, by drug type, 2018 - 2032

9.2.8.2   Market size, by indication, 2018 - 2032

9.2.8.3   Market size, by type of delivery, 2018 - 2032

9.2.8.4   Market size, by packaging, 2018 - 2032

9.2.8.5   Market size, by distribution channel, 2018 - 2032

9.3    Europe

9.3.1    Market size, by country, 2018 - 2032

9.3.2    Market size, by drug type, 2018 - 2032

9.3.3    Market size, by indication, 2018 - 2032

9.3.4    Market size, by type of delivery, 2018 - 2032

9.3.5    Market size, by packaging, 2018 - 2032

9.3.6    Market size, by distribution channel, 2018 - 2032

9.3.7    Germany

9.3.7.1   Market size, by drug type, 2018 - 2032

9.3.7.2   Market size, by indication, 2018 - 2032

9.3.7.3   Market size, by type of delivery, 2018 - 2032

9.3.7.4   Market size, by packaging, 2018 - 2032

9.3.7.5   Market size, by distribution channel, 2018 - 2032

9.3.8    UK

9.3.8.1   Market size, by drug type, 2018 - 2032

9.3.8.2   Market size, by indication, 2018 - 2032

9.3.8.3   Market size, by type of delivery, 2018 - 2032

9.3.8.4   Market size, by packaging, 2018 - 2032

9.3.8.5   Market size, by distribution channel, 2018 - 2032

9.3.9    France

9.3.9.1   Market size, by drug type, 2018 - 2032

9.3.9.2   Market size, by indication, 2018 - 2032

9.3.9.3   Market size, by type of delivery, 2018 - 2032

9.3.9.4   Market size, by packaging, 2018 - 2032

9.3.9.5   Market size, by distribution channel, 2018 - 2032

9.3.10    Italy

9.3.10.1    Market size, by drug type, 2018 - 2032

9.3.10.2    Market size, by indication, 2018 - 2032

9.3.10.3    Market size, by type of delivery, 2018 - 2032

9.3.10.4    Market size, by packaging, 2018 - 2032

9.3.10.5    Market size, by distribution channel, 2018 - 2032

9.3.11    Spain

9.3.11.1    Market size, by drug type, 2018 - 2032

9.3.11.2    Market size, by indication, 2018 - 2032

9.3.11.3    Market size, by type of delivery, 2018 - 2032

9.3.11.4    Market size, by packaging, 2018 - 2032

9.3.11.5    Market size, by distribution channel, 2018 - 2032

9.3.12    Belgium

9.3.12.1    Market size, by drug type, 2018 - 2032

9.3.12.2    Market size, by indication, 2018 - 2032

9.3.12.3    Market size, by type of delivery, 2018 - 2032

9.3.12.4    Market size, by packaging, 2018 - 2032

9.3.12.5    Market size, by distribution channel, 2018 - 2032

9.3.13    Netherlands

9.3.13.1    Market size, by drug type, 2018 - 2032

9.3.13.2    Market size, by indication, 2018 - 2032

9.3.13.3    Market size, by type of delivery, 2018 - 2032

9.3.13.4    Market size, by packaging, 2018 - 2032

9.3.13.5    Market size, by distribution channel, 2018 - 2032

9.3.14    Norway

9.3.14.1    Market size, by drug type, 2018 - 2032

9.3.14.2    Market size, by indication, 2018 - 2032

9.3.14.3    Market size, by type of delivery, 2018 - 2032

9.3.14.4    Market size, by packaging, 2018 - 2032

9.3.14.5    Market size, by distribution channel, 2018 - 2032

9.3.15    Switzerland

9.3.15.1    Market size, by drug type, 2018 - 2032

9.3.15.2    Market size, by indication, 2018 - 2032

9.3.15.3    Market size, by type of delivery, 2018 - 2032

9.3.15.4    Market size, by packaging, 2018 - 2032

9.3.15.5    Market size, by distribution channel, 2018 - 2032

9.4    Asia Pacific

9.4.1    Market size, by country, 2018 - 2032

9.4.2    Market size, by drug type, 2018 - 2032

9.4.3    Market size, by indication, 2018 - 2032

9.4.4    Market size, by type of delivery, 2018 - 2032

9.4.5    Market size, by packaging, 2018 - 2032

9.4.6    Market size, by distribution channel, 2018 - 2032

9.4.7    China

9.4.7.1   Market size, by drug type, 2018 - 2032

9.4.7.2   Market size, by indication, 2018 - 2032

9.4.7.3   Market size, by type of delivery, 2018 - 2032

9.4.7.4   Market size, by packaging, 2018 - 2032

9.4.7.5   Market size, by distribution channel, 2018 - 2032

9.4.8    Japan

9.4.8.1   Market size, by drug type, 2018 - 2032

9.4.8.2   Market size, by indication, 2018 - 2032

9.4.8.3   Market size, by type of delivery, 2018 - 2032

9.4.8.4   Market size, by packaging, 2018 - 2032

9.4.8.5   Market size, by distribution channel, 2018 - 2032

9.4.9    India

9.4.9.1   Market size, by drug type, 2018 - 2032

9.4.9.2   Market size, by indication, 2018 - 2032

9.4.9.3   Market size, by type of delivery, 2018 - 2032

9.4.9.4   Market size, by packaging, 2018 - 2032

9.4.9.5   Market size, by distribution channel, 2018 - 2032

9.4.10    Australia

9.4.10.1    Market size, by drug type, 2018 - 2032

9.4.10.2    Market size, by indication, 2018 - 2032

9.4.10.3    Market size, by type of delivery, 2018 - 2032

9.4.10.4    Market size, by packaging, 2018 - 2032

9.4.10.5    Market size, by distribution channel, 2018 - 2032

9.4.11    South Korea

9.4.11.1    Market size, by drug type, 2018 - 2032

9.4.11.2    Market size, by indication, 2018 - 2032

9.4.11.3    Market size, by type of delivery, 2018 - 2032

9.4.11.4    Market size, by packaging, 2018 - 2032

9.4.11.5    Market size, by distribution channel, 2018 - 2032

9.4.12    Indonesia

9.4.12.1    Market size, by drug type, 2018 - 2032

9.4.12.2    Market size, by indication, 2018 - 2032

9.4.12.3    Market size, by type of delivery, 2018 - 2032

9.4.12.4    Market size, by packaging, 2018 - 2032

9.4.12.5    Market size, by distribution channel, 2018 - 2032

9.4.13    New Zealand

9.4.13.1    Market size, by drug type, 2018 - 2032

9.4.13.2    Market size, by indication, 2018 - 2032

9.4.13.3    Market size, by type of delivery, 2018 - 2032

9.4.13.4    Market size, by packaging, 2018 - 2032

9.4.13.5    Market size, by distribution channel, 2018 - 2032

9.4.14    Singapore

9.4.14.1    Market size, by drug type, 2018 - 2032

9.4.14.2    Market size, by indication, 2018 - 2032

9.4.14.3    Market size, by type of delivery, 2018 - 2032

9.4.14.4    Market size, by packaging, 2018 - 2032

9.4.14.5    Market size, by distribution channel, 2018 - 2032

9.4.15    Thailand

9.4.15.1    Market size, by drug type, 2018 - 2032

9.4.15.2    Market size, by indication, 2018 - 2032

9.4.15.3    Market size, by type of delivery, 2018 - 2032

9.4.15.4    Market size, by packaging, 2018 - 2032

9.4.15.5    Market size, by distribution channel, 2018 - 2032

9.5    Latin America

9.5.1    Market size, by country, 2018 - 2032

9.5.2    Market size, by drug type, 2018 - 2032

9.5.3    Market size, by indication, 2018 - 2032

9.5.4    Market size, by type of delivery, 2018 - 2032

9.5.5    Market size, by packaging, 2018 - 2032

9.5.6    Market size, by distribution channel, 2018 - 2032

9.5.7    Brazil

9.5.7.1   Market size, by drug type, 2018 - 2032

9.5.7.2   Market size, by indication, 2018 - 2032

9.5.7.3   Market size, by type of delivery, 2018 - 2032

9.5.7.4   Market size, by packaging, 2018 - 2032

9.5.7.5   Market size, by distribution channel, 2018 - 2032

9.5.8    Mexico

9.5.8.1   Market size, by drug type, 2018 - 2032

9.5.8.2   Market size, by indication, 2018 - 2032

9.5.8.3   Market size, by type of delivery, 2018 - 2032

9.5.8.4   Market size, by packaging, 2018 - 2032

9.5.8.5   Market size, by distribution channel, 2018 - 2032

9.5.9    Argentina

9.5.9.1   Market size, by drug type, 2018 - 2032

9.5.9.2   Market size, by indication, 2018 - 2032

9.5.9.3   Market size, by type of delivery, 2018 - 2032

9.5.9.4   Market size, by packaging, 2018 - 2032

9.5.9.5   Market size, by distribution channel, 2018 - 2032

9.5.10    Chile

9.5.10.1    Market size, by drug type, 2018 - 2032

9.5.10.2    Market size, by indication, 2018 - 2032

9.5.10.3    Market size, by type of delivery, 2018 - 2032

9.5.10.4    Market size, by packaging, 2018 - 2032

9.5.10.5    Market size, by distribution channel, 2018 - 2032

9.5.11    Colombia

9.5.11.1    Market size, by drug type, 2018 - 2032

9.5.11.2    Market size, by indication, 2018 - 2032

9.5.11.3    Market size, by type of delivery, 2018 - 2032

9.5.11.4    Market size, by packaging, 2018 - 2032

9.5.11.5    Market size, by distribution channel, 2018 - 2032

9.6    Middle East & Africa

9.6.1    Market size, by country, 2018 - 2032

9.6.2    Market size, by drug type, 2018 - 2032

9.6.3    Market size, by indication, 2018 - 2032

9.6.4    Market size, by type of delivery, 2018 - 2032

9.6.5    Market size, by packaging, 2018 - 2032

9.6.6    Market size, by distribution channel, 2018 - 2032

9.6.7    South Africa

9.6.7.1   Market size, by drug type, 2018 - 2032

9.6.7.2   Market size, by indication, 2018 - 2032

9.6.7.3   Market size, by type of delivery, 2018 - 2032

9.6.7.4   Market size, by packaging, 2018 - 2032

9.6.7.5   Market size, by distribution channel, 2018 - 2032

9.6.8    Saudi Arabia

9.6.8.1   Market size, by drug type, 2018 - 2032

9.6.8.2   Market size, by indication, 2018 - 2032

9.6.8.3   Market size, by type of delivery, 2018 - 2032

9.6.8.4   Market size, by packaging, 2018 - 2032

9.6.8.5   Market size, by distribution channel, 2018 - 2032

9.6.9    UAE

9.6.9.1   Market size, by drug type, 2018 - 2032

9.6.9.2   Market size, by indication, 2018 - 2032

9.6.9.3   Market size, by type of delivery, 2018 - 2032

9.6.9.4   Market size, by packaging, 2018 - 2032

9.6.9.5   Market size, by distribution channel, 2018 - 2032

9.6.10    Egypt

9.6.10.1    Market size, by drug type, 2018 - 2032

9.6.10.2    Market size, by indication, 2018 - 2032

9.6.10.3    Market size, by type of delivery, 2018 - 2032

9.6.10.4    Market size, by packaging, 2018 - 2032

9.6.10.5    Market size, by distribution channel, 2018 - 2032

9.6.11    Iran

9.6.11.1    Market size, by drug type, 2018 - 2032

9.6.11.2    Market size, by indication, 2018 - 2032

9.6.11.3    Market size, by type of delivery, 2018 - 2032

9.6.11.4    Market size, by packaging, 2018 - 2032

9.6.11.5    Market size, by distribution channel, 2018 - 2032

Chapter 10   Company Profiles

10.1    Competitive dashboard, 2021

10.2    Bristol Myers Squibb

10.2.1    Business overview

10.2.2    Financial data

10.2.3    Product landscape

10.2.4    Strategic outlook

10.2.5    SWOT analysis

10.3    Gilead Sciences, Inc

10.3.1    Business overview

10.3.2    Financial data

10.3.3    Product landscape

10.3.4    Strategic outlook

10.3.5    SWOT analysis

10.4    Cipla Limited

10.4.1    Business overview

10.4.2    Financial data

10.4.3    Product landscape

10.4.4    Strategic outlook

10.4.5    SWOT analysis

10.5    F. Hoffmann-La Roche Ltd

10.5.1    Business overview

10.5.2    Financial data

10.5.3    Product landscape

10.5.4    Strategic outlook

10.5.5    SWOT analysis

10.6    Novo Nordisk A/S

10.6.1    Business overview

10.6.2    Financial data

10.6.3    Product landscape

10.6.4    Strategic outlook

10.6.5    SWOT analysis

10.7    Sanofi

10.7.1    Business overview

10.7.2    Financial data

10.7.3    Product landscape

10.7.4    Strategic outlook

10.7.5    SWOT analysis

10.8    Aurobindo Pharmaceuticals

10.8.1    Business overview

10.8.2    Financial data

10.8.3    Product landscape

10.8.4    Strategic outlook

10.8.5    SWOT analysis

10.9    Fresenius SE & Co. KGaA (Fresenius Kabi)

10.9.1    Business overview

10.9.2    Financial data

10.9.3    Product landscape

10.9.4    Strategic outlook

10.9.5    SWOT analysis

10.10    Merck & Co., Inc

10.10.1    Business overview

10.10.2    Financial data

10.10.3    Product landscape

10.10.4    Strategic outlook

10.10.5    SWOT analysis

10.11    Zydus Group

10.11.1    Business overview

10.11.2    Financial data

10.11.3    Product landscape

10.11.4    Strategic outlook

10.11.5    SWOT analysis

10.12    Vetter Pharma

10.12.1    Business overview

10.12.2    Financial data

10.12.3    Product landscape

10.12.4    Strategic outlook

10.12.5    SWOT analysis

10.13    Takeda Pharmaceutical Company Limited

10.13.1    Business overview

10.13.2    Financial data

10.13.3    Product landscape

10.13.4    Strategic outlook

10.13.5    SWOT analysis

10.14    Johnson & Johnson Services, Inc

10.14.1    Business overview

10.14.2    Financial data

10.14.3    Product landscape

10.14.4    Strategic outlook

10.14.5    SWOT analysis

Proceed To Buy

USD 4500
USD 3800
USD 1900
USD 1200

Customization Offered

  • check-imgCross-segment Market Size and Analysis for Mentioned Segments
  • check-imgAdditional Company Profiles (Upto 5 With No Cost)
  • check-img Additional Countries (Apart From Mentioned Countries)
  • check-img Country/Region-specific Report
  • check-img Go To Market Strategy
  • check-imgRegion Specific Market Dynamics
  • check-imgRegion Level Market Share
  • check-img Import Export Analysis
  • check-imgProduction Analysis
  • check-imgOthers