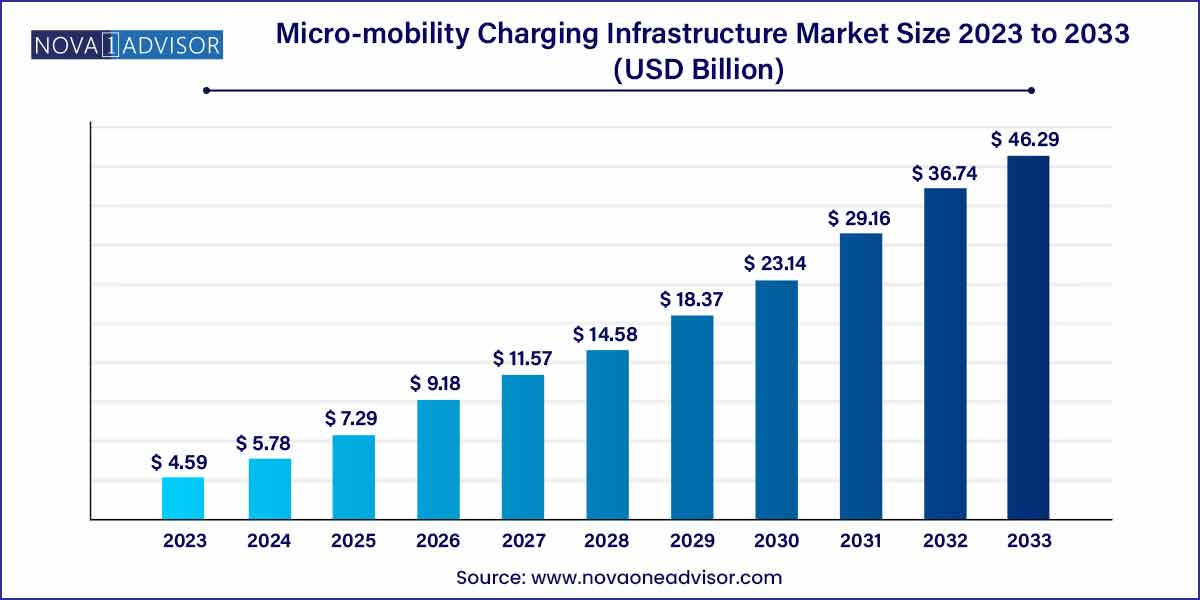
The global micro-mobility charging infrastructure market size was exhibited at USD 4.59 billion in 2023 and is projected to hit around USD 46.29 billion by 2033, growing at a CAGR of 26.00% during the forecast period of 2024 to 2033.

Key Takeaways:
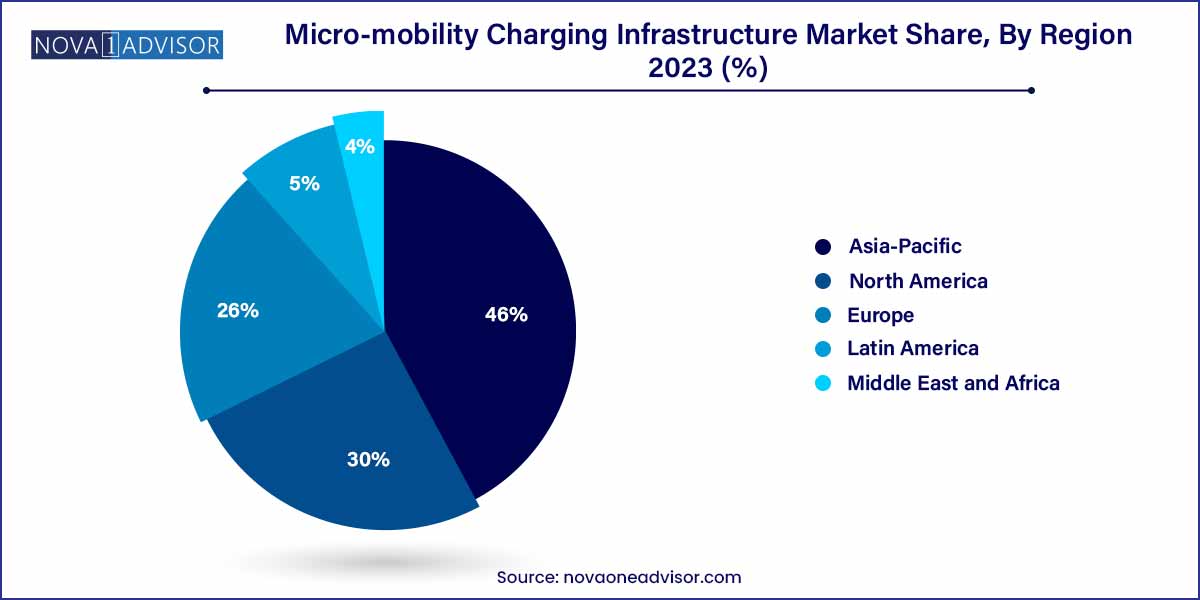
- Asia Pacific dominated the market and accounted for the largest revenue share of 46.0% in 2023.
- The e-scooters segment accounted for the largest revenue share of 60.3% in 2023 and is expected to expand at the fastest CAGR of 26.4% over the forecast period.
- The wired segment accounted for the largest revenue share of around 53.2% in 2023.
- The battery-powered segment held the largest revenue share of 55.1% in 2023.
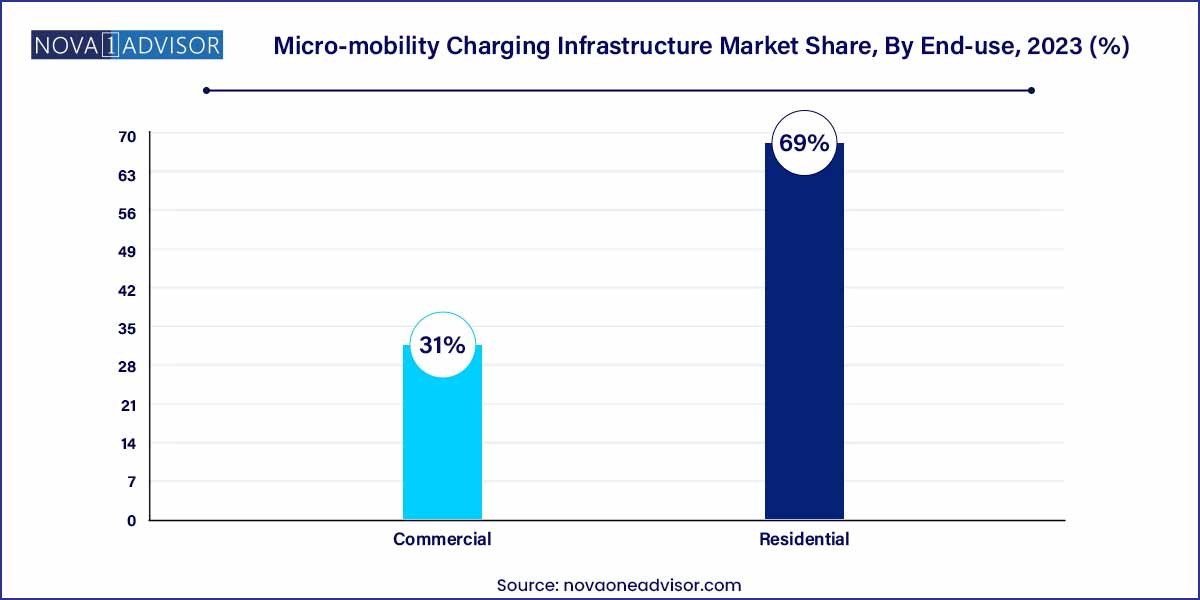
- The residential segment held the largest revenue share of 69.0% in 2023 and is expected to expand at the fastest CAGR over the forecast period.
Market Overview
The micro-mobility charging infrastructure market has emerged as a vital enabler of the urban mobility revolution. With the proliferation of e-scooters, e-bikes, e-unicycles, and e-skateboards across cities globally, the need for reliable, accessible, and scalable charging networks has never been more critical. These compact, electric-powered vehicles offer solutions to urban congestion, air pollution, and last-mile connectivity challenges; however, their widespread adoption depends heavily on a supporting ecosystem that includes efficient and sustainable charging infrastructure.
The growth of micro-mobility services, including dockless ride-sharing programs and private ownership trends, has accelerated investments into charging hubs, battery swapping stations, and wireless charging solutions. Public and private stakeholders are collaborating to integrate micro-mobility into city transport systems, requiring charging networks that are resilient, user-friendly, and environmentally sustainable.
The market is characterized by dynamic technological advancements, partnerships between municipalities and private providers, and evolving business models. As smart cities initiatives gain traction and consumer preferences shift toward greener modes of transportation, micro-mobility charging infrastructure is set to be a cornerstone of future urban transport systems.
Micro-mobility Charging Infrastructure Market Report Scope
| Report Coverage |
Details |
| Market Size in 2024 |
USD 4.59 Billion |
| Market Size by 2033 |
USD 46.29 Billion |
| Growth Rate From 2024 to 2033 |
CAGR of 26.0% |
| Base Year |
2023 |
| Forecast Period |
2024-2033 |
| Segments Covered |
Vehicle Type, Charger Type, Power Source, End-use, Region |
| Market Analysis (Terms Used) |
Value (US$ Million/Billion) or (Volume/Units) |
| Regional Scope |
North America; Europe; Asia Pacific; Central and South America; the Middle East and Africa |
| Key Companies Profiled |
Ather Energy.; bike-energy; Bikeep; Flower Turbines.; Get Charged, Inc.; Giulio Barbieri SRL; Ground Control Systems.; Magment; Perch Mobility; Robert Bosch GmbH; Solum; SWIFTMILE; The Mobility House GmbH. |
Micro-mobility Charging Infrastructure Market Dynamics
The micro-mobility charging infrastructure market is driven by various factors that contribute to its dynamic growth. Government initiatives, aimed at fostering sustainable and environmentally friendly urban transportation, play a pivotal role. As cities grapple with congestion and pollution, authorities globally are incentivizing the adoption of electric micro-mobility solutions. Additionally, private sector investments in charging infrastructure contribute significantly to market expansion. Companies recognize the burgeoning demand for efficient charging stations and technologies, prompting increased funding in research and development.
Despite the promising growth, the micro-mobility charging infrastructure market faces notable challenges. A primary concern lies in the lack of standardized charging infrastructure, hindering seamless integration across different micro-mobility platforms. Regulatory hurdles and zoning issues also pose substantial obstacles, as the establishment of charging stations requires compliance with diverse local regulations. Moreover, the need for significant upfront investments for infrastructure development remains a challenge for both public and private entities.
Micro-mobility Charging Infrastructure Market Restraint
One prominent restraint in the micro-mobility charging infrastructure market is the lack of standardized technologies and protocols. The absence of universally accepted standards for charging interfaces and station designs creates interoperability challenges. This lack of standardization can impede the seamless integration of different micro-mobility platforms, causing complications for both operators and users. As a result, the industry must address the pressing need for standardization to ensure compatibility and promote the widespread adoption of electric micro-mobility solutions.
- Regulatory Hurdles and Zoning Issues:
Regulatory complexities and zoning challenges present significant hurdles for the establishment of micro-mobility charging infrastructure. Local regulations governing the installation and operation of charging stations vary widely, leading to a fragmented landscape. Zoning restrictions, permitting processes, and land-use policies can slow down the deployment of charging stations, creating obstacles for businesses and municipalities alike. Overcoming these regulatory hurdles requires collaborative efforts between public authorities, private entities, and industry stakeholders to streamline processes and facilitate the efficient expansion of micro-mobility charging infrastructure.
Micro-mobility Charging Infrastructure Market Opportunity
- Urbanization and Last-Mile Connectivity:
An outstanding opportunity in the micro-mobility charging infrastructure market lies in addressing the challenges of urbanization and enhancing last-mile connectivity. As cities continue to grow, the need for efficient, sustainable transportation solutions becomes increasingly critical. Micro-mobility, supported by a robust charging infrastructure, offers a viable solution for short-distance travel. Meeting this demand presents an opportunity for businesses and governments to invest in and expand micro-mobility charging networks, creating a more accessible and interconnected urban transportation ecosystem.
- Integration of Advanced Technologies:
The integration of advanced technologies within micro-mobility charging infrastructure represents a significant opportunity for market growth. Innovations such as smart charging stations, real-time monitoring, and wireless charging solutions enhance user experience and system efficiency. Leveraging these technologies not only attracts a tech-savvy user base but also contributes to the overall sustainability and attractiveness of micro-mobility solutions. Companies investing in research and development to incorporate cutting-edge technologies position themselves to capitalize on this growing market opportunity and stay ahead in the evolving landscape of micro-mobility charging infrastructure.
Micro-mobility Charging Infrastructure Market Challenges
A primary challenge in the micro-mobility charging infrastructure market is the absence of standardized technologies and protocols. The diverse array of micro-mobility platforms and their unique charging requirements has led to a lack of universal standards for charging interfaces and station designs. This lack of standardization complicates interoperability, hindering the seamless integration of charging infrastructure across different micro-mobility services. Industry stakeholders must collaboratively work towards establishing common standards to ensure compatibility and foster a more cohesive and efficient charging network.
- Regulatory Complexity and Zoning Issues:
Regulatory hurdles and zoning challenges pose significant obstacles to the growth of micro-mobility charging infrastructure. The establishment of charging stations is subject to varying local regulations, permitting processes, and land-use policies, creating a fragmented and complex landscape. Navigating through these regulatory intricacies demands time and resources, potentially delaying the deployment of charging infrastructure. Overcoming these challenges requires close collaboration between public authorities, private entities, and industry stakeholders to streamline regulatory processes and facilitate the efficient expansion of micro-mobility charging networks.
Segments Insights:
Vehicle Type Insights
E-scooters dominate the vehicle type segment, primarily due to their widespread use in shared mobility programs across urban centers globally. E-scooters are easy to deploy, require minimal space, and are favored for short-distance, last-mile trips. Consequently, dedicated charging solutions for e-scooters — from docking stations to swappable battery hubs — form a major portion of the installed infrastructure.
E-bikes are the fastest-growing vehicle type, supported by rising consumer preference for personal ownership and longer commuting capabilities. E-bikes often require higher-capacity charging setups, and commercial fleet operators are increasingly investing in specialized charging stations that cater to both public and private users. Their integration into public bike-share schemes is also fueling infrastructure expansion.
Charger Type Insights
Wired chargers dominate the charger type segment, as they are cost-effective, simple to deploy, and compatible with most commercially available micro-mobility vehicles. Wired solutions are common across public docking stations, fleet operator hubs, and residential installations, offering standardization and ease of use.
Wireless chargers are the fastest-growing charger type, thanks to their convenience, reduced wear-and-tear, and support for automated fleets. Inductive charging pads embedded in streets, docking bays, or special platforms allow vehicles to charge without manual plug-ins, promoting automation and minimizing maintenance issues. Several smart city projects are piloting wireless micro-mobility charging hubs as part of future-ready urban infrastructure.
Power Source Insights
Battery-powered charging stations currently dominate, particularly for mobile or semi-permanent installations where grid access is limited or temporary setups are needed. These solutions offer flexibility and can be rapidly deployed at event sites, temporary zones, or emerging urban hubs.
Solar-powered stations are the fastest-growing power source segment, fueled by the dual emphasis on sustainability and energy independence. Solar panels integrated into charging hubs reduce grid dependency, promote green branding for cities and operators, and lower long-term operational costs. As renewable energy adoption accelerates, solar micro-mobility chargers are becoming a preferred choice for eco-conscious deployments.
End-use Insights
Commercial end-use leads the micro-mobility charging infrastructure market, with fleet operators, shared mobility providers, and urban transit agencies driving large-scale deployments. Centralized fleet charging depots, public docking stations, and mobility hubs cater primarily to commercial applications aiming for operational efficiency and revenue optimization.

Residential end-use is the fastest-growing segment, propelled by the rising ownership of personal e-scooters and e-bikes. Consumers increasingly demand residential charging solutions such as wall-mounted chargers, secure docking racks, and home solar-powered units. Homebuilders and residential developers are starting to integrate micro-mobility charging amenities into new smart housing projects to meet this growing demand.
Regional Insights
Europe dominates the micro-mobility charging infrastructure market, owing to early adoption of sustainable mobility initiatives, strong government support, and high urban population density. Countries such as Germany, France, the Netherlands, and the Nordics have pioneered integrated micro-mobility programs and invested heavily in charging infrastructure. The European Green Deal and related policies continue to bolster funding for micro-mobility projects.

Asia-Pacific is the fastest-growing region, led by rapid urbanization, growing middle-class income, and massive micro-mobility adoption in countries like China, India, Japan, and South Korea. China, in particular, has witnessed an explosion of e-scooter and e-bike usage, necessitating vast investments in both public and private charging networks. Government initiatives aimed at reducing urban pollution and promoting smart city concepts further drive infrastructure growth across the region.
Recent Developments
-
Charge Enterprises Inc. (March 2025): Launched a modular solar-powered micro-mobility charging hub pilot in Miami, Florida, targeting public e-scooter fleets.
-
Swiftmile Inc. (February 2025): Expanded its wireless charging platform for e-scooters and e-bikes to European cities including Paris and Madrid through municipal partnerships.
-
Loop Mobility (January 2025): Rolled out its first residential micro-mobility charger series for private users in North America, compatible with major e-bike and e-scooter brands.
-
Bikeep (December 2024): Introduced a smart charging and parking rack system with integrated payment solutions aimed at commercial and campus use in urban areas.
-
Yulu Bikes (November 2024): Partnered with leading Indian real estate developers to integrate battery-swapping and residential micro-mobility charging solutions into upcoming smart city projects.
Some of the prominent players in the micro-mobility charging infrastructure market include:
- Ather Energy
- bike-energy
- Bikeep
- Flower Turbines
- Get Charged, Inc.
- Giulio Barbieri SRL
- Ground Control Systems
- Magment
- Perch Mobility
- Robert Bosch GmbH
- Solum
- SWIFTMILE
- The Mobility House GmbH
Segments Covered in the Report
This report forecasts revenue growth at global, regional, and country levels and provides an analysis of the latest industry trends in each of the sub-segments from 2021 to 2033. For this study, Nova one advisor, Inc. has segmented the global micro-mobility charging infrastructure market.
Vehicle Type
- E-scooters
- E-bikes
- E-unicycles
- E-skateboards
Charger Type
Power Source
- Solar Powered
- Battery Powered
End-use
By Region
- North America
- Europe
- Asia-Pacific
- Latin America
- Middle East & Africa (MEA)


