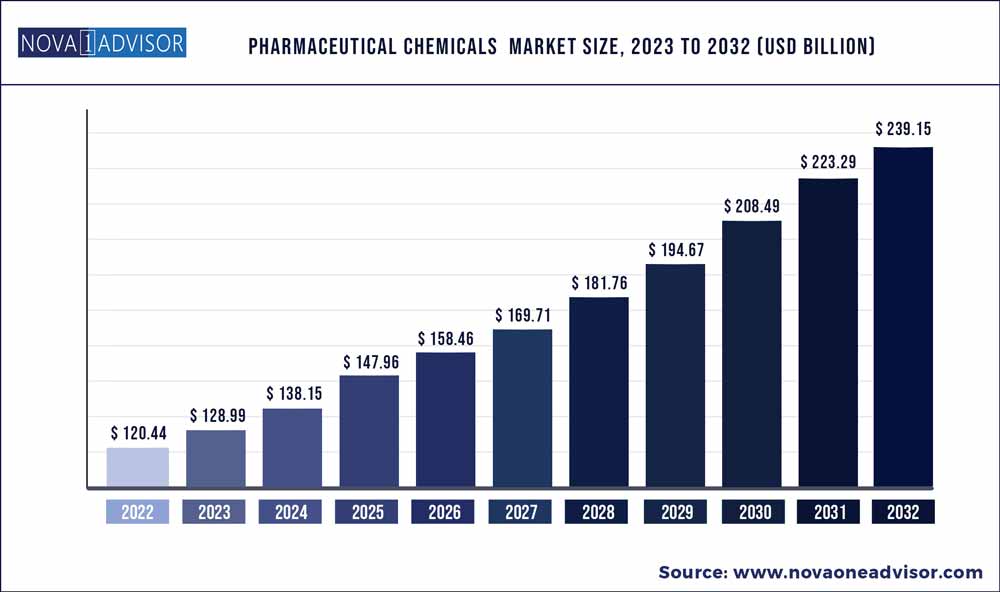
The global pharmaceutical chemicals market size was exhibited at USD 120.44 billion in 2022 and is projected to hit around USD 239.15 billion by 2032, growing at a CAGR of 3.90% during the forecast period 2023 to 2032.
Crucial factors accountable for market growth are:
The healthcare industry is flourishing on the back of increased disposable income of urban population and escalating percentage of geriatrics in the world’s population. Consequently, the demand for pharmaceuticals is on the rise, providing a strong traction to the global pharmaceutical chemicals market. Forming the basic ingredients for the manufacturing of medicines, the market for pharmaceutical chemicals functions under high safety standards
Rise in non-communicable diseases, aging population, life expectancy, improved income level a larger masses in BRICS nations, increased government expenditure on healthcare, and ongoing research and development are some of the key trends behind the growth of the pharmaceutical chemicals market.
Geographically, North America accounted for the maximum, 50.9%, share of the total demand in the global pharmaceutical chemicals market in 2022. The strength of the demand from North America can be ascribed to the increase in demand from consumer base in the region, primarily from the developed countries of the U.S. and Canada. The U.S. houses the headquarters and prominent shareholders of some of the leading companies operating in this market, which is also in the favor of the North America pharmaceutical chemicals market. Europe also served a prominent share of demand at 28.1% in the global pharmaceutical chemicals market in 2022 and is expected to flourish further during the forecast period. That being said, the analysts of the report have highlighted Asia Pacific as a region with tremendous opportunities, projecting the demand from the region to increment at an above-average CAGR of 11.7% during the forecast period of 2023 to 2032. The global market share of Latin America and Middle East and Africa is expected to increase, but at a slow pace in the near future.
Pharmaceutical chemicals Market Segmentation
| Product Type | Application Type |
|
Basic building blocks Advanced intermediates Active ingredients |
Cardiovascular Neurology Oncology Infectious diseases Metabolic system Diabetes Respiratory diseases Gastrointestinal diseases Musculoskeletal diseases Other
|
Pharmaceutical chemicals Market Key Players And Regions
| Companies Profiled | Regions Covered |
|
BASF Lonza Porton Fine Chemicals Dishman Lanxess Johnson Matthey Vertellus Holdings Jubilant Life Sciences Hikal Abbott |
North America Europe Asia-Pacific Latin America Middle East & Africa (MEA)
|
Pharmaceutical Chemicals Market
