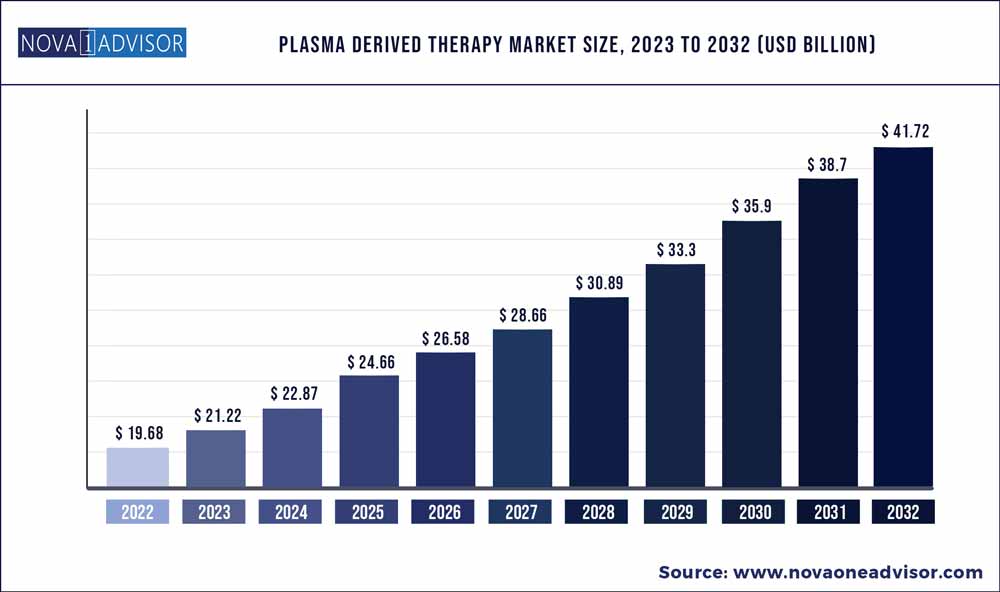
The global plasma derived therapy market size accounted for USD 19.68 billion in 2022 and is estimated to achieve a market size of USD 19.68 billion by 2032 growing at a CAGR of 7.8% from 2023 to 2032.
Key Pointers:
Increasing prevalence of rare diseases including primary immunodeficiency diseases, idiopathic thrombocytopenic purpura (ITP), von Willebrand disease, and others are one of the major factors contributing to the business growth across the globe.
According to the report published by the Centres for Disease Control and Prevention in 2022, around 4.2 million people in U.S. suffer from von Willebrand disease. Hence, the availability of effective plasma derived therapy that offers effective solution against these rare diseases will lead to unprecedented growth opportunities to the plasma derived therapy market in the forthcoming years.
The incidence of coronavirus infection has affected millions of individuals worldwide that had temporarily impacted the plasma donation globally, also affected the plasma derived therapy market. However, due to unavailability of specific treatment medicine and vaccine against COVID-19, research institutes have focused on plasma-based therapy to identify any role in treating the COVID-19.
Further, in March 2020, the Houston Methodist Hospital, U.S., announced use of plasma fractionation for treatment of COVID-19 and became the first hospital in U.S. to offer plasma derived therapy among COVID-19 patients. Therefore, high incidence rate of COVID-19 patients has resulted in increased demand for plasma derived immunoglobulins.
Plasma derived therapy is effective treatment derived from human plasma and widely used for the treatment of rare and complex diseases. Plasma-derived therapies help to replace deficient or missing proteins that allow people to lead more healthy and productive lives. The plasma-derived products majorly include coagulation factors, albumin and immunoglobulins that are used as life-saving therapeutics to treat several genetic, and life-threatening diseases globally.
Plasma industry is continuously investing in research and development activities to develop new plasma therapies leading to innovative treatments benefitting the patients. For instance, in March 2016, Grifols had invested USD 360 million in order to expand their production capabilities for plasma-derived therapies. This investment has helped company to enhance its place in the market coupled with its plasma fractionation capacity and purification facility.
Moreover, several other pharmaceutical and biotechnology companies had significant investment towards research and development to develop convalescent plasma therapy to treat critically ill COVID-19 patients. Additionally, favourable regulatory support to develop and commercialize plasma derived therapy is another factor benefiting the market growth. Thus, the aforementioned factors primarily drive the plasma derived therapy market share in 2022.
North America plasma derived therapy market held over 54% business share in 2022 and is projected to experience remarkable growth during the foreseeable future. Favourable government initiatives and expanding coverage of plasma collection centres by leading market players will offer growth opportunities to the market. Furthermore, increasing awareness about plasma derived therapies among blood donors, and favourable initiatives undertaken by major market players to stimulate blood donation in the region will accelerate the regional revenue growth.
Adding to this, U.S. market dominated the North America plasma derived therapy industry in 2022 with significant demand as well as high plasma volume in the region. Increase in number of patients with rare diseases has strengthened the growth potential of market players operating in the country.
Plasma Derived Therapy Market Segmentation
| By Product | By Application |
|
Immunoglobulin Coagulation factors Albumin Others |
Hemophilia Primary immunodeficiency disease Idiopathic thrombocytopenic purpura Others |
Plasma Derived Therapy Market Key Players And Regions
| Companies Profiled | Regions Covered |
|
CSL Behring Takeda Pharmaceutical Company Limited BPL ADMA Biologics Biotest AG Octapharma Grifols Kamada Pharmaceuticals SK Plasma SA Kedrion Pfizer |
North America Europe Asia-Pacific Latin America Middle East & Africa (MEA)
|
Plasma Derived Therapy Market
