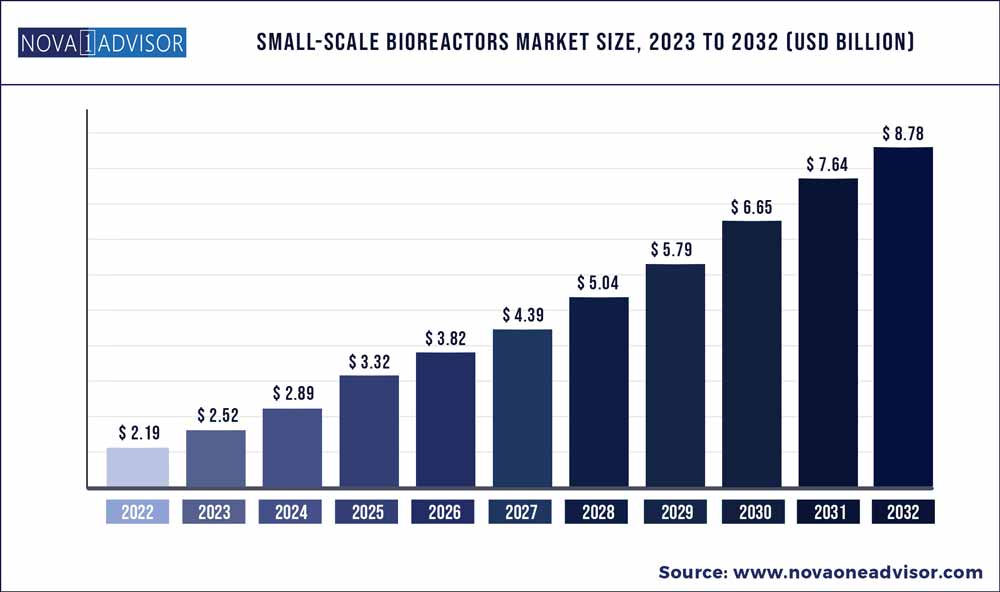
The global small-scale bioreactors market size was exhibited at USD 2.19 billion in 2022 and is projected to hit around USD 8.78 billion by 2032, growing at a CAGR of 14.9% during the forecast period 2023 to 2032.
Key Pointers:
Small-scale Bioreactors Market Report Scope
Report Coverage | Details |
Market Size in 2023 | USD 2.52 Billion |
Market Size by 2032 | USD 2.52 Billion |
Growth Rate From 2023 to 2032 | CAGR of 14.9% |
Base Year | 2022 |
Forecast Period | 2023 to 2032 |
Segments Covered | Product, Capacity, End-user, |
Market Analysis (Terms Used) | Value (US$ Million/Billion) or (Volume/Units) |
Regional Scope | North America; Europe; Asia Pacific; Central and South America; the Middle East and Africa |
Key Companies Profiled |
Sartorius AG; Thermo Fisher Scientific Inc.; Merck KGaA; Danaher Corp.; Lonza Group; Eppendorf AG; Miltenyi Biotec; Getinge AB; Solaris Biotechnology Srl; Infors AG
|
The key drivers responsible for the market growth include the wide-scale product usage in the pharmaceutical industry along with portfolio expansion by major players. Small-scale bioreactors are essential for the development and optimization of processes, therefore they are frequently used in pharmaceutical and biopharmaceutical research. These bioprocessing equipment are generally used for small-scale production and range in size from a few milliliters to 5-10 L. The COVID-19 pandemic has witnessed an increased demand as a result of the sudden rise in COVID-19 cases.
The sales of small-scale bioreactors significantly increased in 2020 and 2021 as a result of numerous businesses expanding their facilities to carry out R&D for COVID-19 vaccines. Moreover, the worldwide immunization campaigns around the globe and the rising demand are expected to increase product sales during the forecast period. In addition, heavy investments by government authorities to improve biopharmaceutical research and the development of a vaccine are also influencing the industry’s growth. For instance, the South Korean government allocated USD 250 million in April 2020 to launch the Vaccine Innovative Technology Alliance (VITAL), which will help with vaccine research, production, and use. To make South Korea the fifth-largest vaccine manufacturer throughout the globe by 2025 and reach 80% vaccine self-sufficiency, the nation has spent an additional $2 billion on the K Vaccine program.
Moreover, the rising prevalence of chronic diseases, such as cancer, cardiac disease, diabetes, and hypertension, has led to more focus on the development of innovative biological therapies. Similarly, the demand for monoclonal antibodies as well as personalized medicines has increased bioproduction, accelerating small-scale bioreactor demand. Furthermore, the rising usage of high-end technologies to simplify complex manufacturing will enhance the demand for small-scale bioreactors during the forecast period. In addition, the high investments in research and development activities by key biopharmaceutical companies are expected to drive industry growth. For instance, in august 2021, PBS Biotech, a manufacturer of single-use bioprocessing devices, completed a USD 10 million private financing round with BroadOak Capital Partners.
With the funds, the company will have the opportunity to grow and commercialize its line of single-use bioreactor devices and outsourced process design services. Due to the demand for superior quality and better efficiency in drug manufacturing, the biopharmaceutical industry is quickly shifting toward the use of single-use bioprocessing systems with integrated real-time monitoring and technical analysis that can facilitate automation, enhance data-driven quality control, and continue driving performance. Therefore, it is expected that the shift toward advanced bioprocessing technology devices, such as small-scale bioreactors, will propel the growth of this market.
Some of the prominent players in the Small-scale Bioreactors Market include:
Segments Covered in the Report
This report forecasts revenue growth at global, regional, and country levels and provides an analysis of the latest industry trends in each of the sub-segments from 2018 to 2032. For this study, Nova one advisor, Inc. has segmented the global Small-scale Bioreactors market.
By Product
By Capacity
By End-user
By Region
Chapter 1. Methodology and Scope
1.1. Information Procurement
1.2. Information or Data Analysis
1.3. Market Scope & Segment Definition
1.4. Market Model
1.4.1. Market Study, By Company Market Share
1.4.2. Regional Analysis
Chapter 2. Executive Summary
2.1. Market Snapshot
2.2. Segment Snapshot
2.3. Competitive Landscape Snapshot
Chapter 3. Market Variables, Trends, & Scope
3.1. Market Segmentation and Scope
3.2. Market Lineage Outlook
3.2.1. Parent Market Outlook
3.2.2. Related/Ancillary Market Outlook
3.3. Market Dynamics
3.3.1. Market Driver Analysis
3.3.1.1. Increasing research & development activities in the biopharmaceutical industry
3.3.1.2. Highly competitive market and various strategies undertaken by market players
3.3.1.3. Increasing demand for single use small-scale bioreactors
3.3.2. Market Restraint Analysis
3.3.2.1. Limitations of small-scale bioreactors
3.4. Industry Analysis Tools
3.4.1. SWOT Analysis; By Factor (Political & Legal, Economic And Technological)
3.4.2. Porter's Five Forces Analysis
3.4.3. Penetration and Growth Prospect Mapping, 2023
3.5. COVID-19 Impact Analysis
Chapter 4. Small-Scale Bioreactors Market: Product Business Analysis
4.1. Small-Scale Bioreactors Market: Product Market Share Analysis
4.2. Small-Scale Bioreactors Market Estimates & Forecast, By Product
4.3. Reusable Bioreactors
4.3.1. Global Reusable Bioreactors Market, 2020 - 2032
4.3.2. Stainless Steel Bioreactors
4.3.2.1. Global Stainless Steel Bioreactors Market, 2020 - 2032
4.3.3. Glass Bioreactors
4.3.3.1. Global Glass Bioreactors Market, 2020 - 2032
4.4. Single-use Bioreactors
4.4.1. Global Single-use Bioreactors Market, 2020 - 2032
Chapter 5. Small-Scale Bioreactors Market: Capacity Business Analysis
5.1. Small-Scale Bioreactors Market: Capacity Market Share Analysis
5.2. Small-Scale Bioreactors Market Estimates & Forecast, By Capacity
5.3. 5 ML- 100 ML
5.3.1. Global 5 ML - 100 ML Market, 2020 - 2032
5.4. 100 ML - 250 ML
5.4.1. Global 100 ML - 250 ML Market, 2020 - 2032
5.5. 250 ML - 500 ML
5.5.1. Global 250 ML - 500 ML Market, 2020 - 2032
5.6. 500 ML - 1 L
5.6.1. Global 500 ML - 1 L Market, 2020 - 2032
5.7. 1 L - 3 L
5.7.1. Global 1 L - 3 L Market, 2020 - 2032
5.8. 3 L - 5 L
5.8.1. Global 3 L - 5 L Market, 2020 - 2032
Chapter 6. Small-Scale Bioreactors Market: End-user Business Analysis
6.1. Small-Scale Bioreactors Market: End-User Market Share Analysis
6.2. Small-Scale Bioreactors Market Estimates & Forecast, By End-User
6.3. Pharmaceutical & Biopharmaceutical Companies
6.3.1. Global Pharmaceutical & Biopharmaceutical Companies Market, 2020 - 2032
6.4. CROs & CMOs
6.4.1. Global CROs & CMOs Market, 2020 - 2032
6.5. Academic & Research Institutes
6.5.1. Global Academic & Research Institutes Market, 2020 - 2032
Chapter 7. Small-Scale Bioreactors Market: Regional Business Analysis
7.1. Small-Scale Bioreactors Market Share By Region, 2023 & 2032
7.2. North America
7.2.1. North America Small-Scale Bioreactors Market, 2020 - 2032
7.2.2. U.S.
7.2.2.1. Key Country Dynamics
7.2.2.2. Competitive Scenario
7.2.2.3. Regulatory Framework
7.2.2.4. U.S. Small-Scale Bioreactors Market, 2020 - 2032
7.2.3. Canada
7.2.3.1. Key Country Dynamics
7.2.3.2. Competitive Scenario
7.2.3.3. Regulatory Framework
7.2.3.4. Canada Small-Scale Bioreactors Market, 2020 - 2032
7.3. Europe
7.3.1. Europe Small-Scale Bioreactors Market, 2020 - 2032
7.3.2. U.K.
7.3.2.1. Key Country Dynamics
7.3.2.2. Competitive Scenario
7.3.2.3. Regulatory Framework
7.3.2.4. U.K. Small-Scale Bioreactors Market, 2020 - 2032
7.3.3. Germany
7.3.3.1. Key Country Dynamics
7.3.3.2. Competitive Scenario
7.3.3.3. Regulatory Framework
7.3.3.4. Germany Small-Scale Bioreactors Market, 2020 - 2032
7.3.4. France
7.3.4.1. Key Country Dynamics
7.3.4.2. Competitive Scenario
7.3.4.3. Regulatory Framework
7.3.4.4. France Small-Scale Bioreactors Market, 2020 - 2032
7.3.5. Italy
7.3.5.1. Key Country Dynamics
7.3.5.2. Competitive Scenario
7.3.5.3. Regulatory Framework
7.3.5.4. Italy Small-Scale Bioreactors Market, 2020 - 2032
7.3.6. Spain
7.3.6.1. Key Country Dynamics
7.3.6.2. Competitive Scenario
7.3.6.3. Regulatory Framework
7.3.6.4. Spain Small-Scale Bioreactors Market, 2020 - 2032
7.3.7. Denmark
7.3.7.1. Key Country Dynamics
7.3.7.2. Competitive Scenario
7.3.7.3. Regulatory Framework
7.3.7.4. Denmark Small-Scale Bioreactors Market, 2020 - 2032
7.3.8. Sweden
7.3.8.1. Key Country Dynamics
7.3.8.2. Competitive Scenario
7.3.8.3. Regulatory Framework
7.3.8.4. Sweden Small-Scale Bioreactors Market, 2020 - 2032
7.3.9. Norway
7.3.9.1. Key Country Dynamics
7.3.9.2. Competitive Scenario
7.3.9.3. Regulatory Framework
7.3.9.4. Norway Small-Scale Bioreactors Market, 2020 - 2032
7.4. Asia Pacific
7.4.1. Asia Pacific Small-Scale Bioreactors Market, 2020 - 2032
7.4.2. Japan
7.4.2.1. Key Country Dynamics
7.4.2.2. Competitive Scenario
7.4.2.3. Regulatory Framework
7.4.2.4. Japan Small-Scale Bioreactors Market, 2020 - 2032
7.4.3. China
7.4.3.1. Key Country Dynamics
7.4.3.2. Competitive Scenario
7.4.3.3. Regulatory Framework
7.4.3.4. China Small-Scale Bioreactors Market, 2020 - 2032
7.4.4. India
7.4.4.1. Key Country Dynamics
7.4.4.2. Competitive Scenario
7.4.4.3. Regulatory Framework
7.4.4.4. India Small-Scale Bioreactors Market, 2020 - 2032
7.4.5. Australia
7.4.5.1. Key Country Dynamics
7.4.5.2. Competitive Scenario
7.4.5.3. Regulatory Framework
7.4.5.4. Australia Small-Scale Bioreactors Market, 2020 - 2032
7.4.6. Thailand
7.4.6.1. Key Country Dynamics
7.4.6.2. Competitive Scenario
7.4.6.3. Regulatory Framework
7.4.6.4. Thailand Small-Scale Bioreactors Market, 2020 - 2032
7.4.7. South Korea
7.4.7.1. Key Country Dynamics
7.4.7.2. Competitive Scenario
7.4.7.3. Regulatory Framework
7.4.7.4. South Korea Small-Scale Bioreactors Market, 2020 - 2032
7.5. Latin America
7.5.1. Latin America Small-Scale Bioreactors Market, 2020 - 2032
7.5.2. Brazil
7.5.2.1. Key Country Dynamics
7.5.2.2. Competitive Scenario
7.5.2.3. Regulatory Framework
7.5.2.4. Brazil Small-Scale Bioreactors Market, 2020 - 2032
7.5.3. Mexico
7.5.3.1. Key Country Dynamics
7.5.3.2. Competitive Scenario
7.5.3.3. Regulatory Framework
7.5.3.4. Mexico Small-Scale Bioreactors Market, 2020 - 2032
7.5.4. Argentina
7.5.4.1. Key Country Dynamics
7.5.4.2. Competitive Scenario
7.5.4.3. Regulatory Framework
7.5.4.4. Argentina Small-Scale Bioreactors Market, 2020 - 2032
7.6. MEA
7.6.1. MEA Small-Scale Bioreactors Market, 2020 - 2032
7.6.2. South Africa
7.6.2.1. Key Country Dynamics
7.6.2.2. Competitive Scenario
7.6.2.3. Regulatory Framework
7.6.2.4. South Africa Small-Scale Bioreactors Market, 2020 - 2032
7.6.3. Saudi Arabia
7.6.3.1. Key Country Dynamics
7.6.3.2. Competitive Scenario
7.6.3.3. Regulatory Framework
7.6.3.4. Saudi Arabia Small-Scale Bioreactors Market, 2020 - 2032
7.6.4. UAE
7.6.4.1. Key Country Dynamics
7.6.4.2. Competitive Scenario
7.6.4.3. Regulatory Framework
7.6.4.4. UAE Small-Scale Bioreactors Market, 2020 - 2032
7.6.5. Kuwait
7.6.5.1. Key Country Dynamics
7.6.5.2. Competitive Scenario
7.6.5.3. Regulatory Framework
7.6.5.4. Kuwait Small-Scale Bioreactors Market, 2020 - 2032
Chapter 8. Competitive Landscape
8.1. Company Categorization
8.2. Strategy Mapping
8.3. Company Profiles/Listing
8.3.1. Sartorius AG
8.3.1.1. Overview
8.3.1.2. Financial Performance (Net Revenue/Sales/EBITDA/Gross Profit)
8.3.1.3. Product Benchmarking
8.3.1.4. Strategic Initiatives
8.3.2. Thermo Fisher Scientific Inc.
8.3.2.1. Overview
8.3.2.2. Financial Performance (Net Revenue/Sales/EBITDA/Gross Profit)
8.3.2.3. Product Benchmarking
8.3.2.4. Strategic Initiatives
8.3.3. Merck KGaA
8.3.3.1. Overview
8.3.3.2. Financial Performance (Net Revenue/Sales/EBITDA/Gross Profit)
8.3.3.3. Product Benchmarking
8.3.3.4. Strategic Initiatives
8.3.4. Danaher Corporation
8.3.4.1. Overview
8.3.4.2. Financial Performance (Net Revenue/Sales/EBITDA/Gross Profit)
8.3.4.3. Product Benchmarking
8.3.4.4. Strategic Initiatives
8.3.5. Lonza Group
8.3.5.1. Overview
8.3.5.2. Financial Performance (Net Revenue/Sales/EBITDA/Gross Profit)
8.3.5.3. Product Benchmarking
8.3.5.4. Strategic Initiatives
8.3.6. Eppendorf AG
8.3.6.1. Overview
8.3.6.2. Financial Performance (Net Revenue/Sales/EBITDA/Gross Profit)
8.3.6.3. Product Benchmarking
8.3.6.4. Strategic Initiatives
8.3.7. Miltenyi Biotec
8.3.7.1. Overview
8.3.7.2. Financial Performance (Net Revenue/Sales/EBITDA/Gross Profit)
8.3.7.3. Product Benchmarking
8.3.7.4. Strategic Initiatives
8.3.8. Getinge AB
8.3.8.1. Overview
8.3.8.2. Financial Performance (Net Revenue/Sales/EBITDA/Gross Profit)
8.3.8.3. Product Benchmarking
8.3.8.4. Strategic Initiatives
8.3.9. Solaris Biotechnology Srl
8.3.9.1. Overview
8.3.9.2. Financial Performance (Net Revenue/Sales/EBITDA/Gross Profit)
8.3.9.3. Product Benchmarking
8.3.9.4. Strategic Initiatives
8.3.10. Infors AG
8.3.10.1. Overview
8.3.10.2. Financial Performance (Net Revenue/Sales/EBITDA/Gross Profit)
8.3.10.3. Product Benchmarking
8.3.10.4. Strategic Initiatives