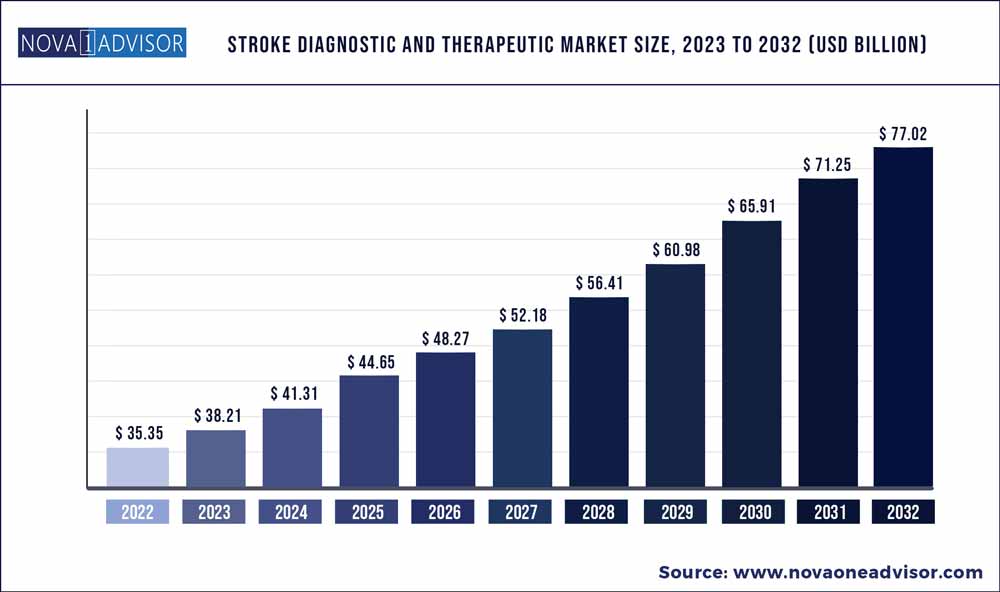
The global stroke diagnostic and therapeutic market size was exhibited at USD 35.35 billion in 2022 and is projected to hit around USD 77.02 billion by 2032, growing at a CAGR of 3.5% during the forecast period 2023 to 2032.
Key Pointers:
Stroke diagnostic and therapeutic Market Report Scope
| Report Coverage | Details |
| Market Size in 2023 | USD 38.21 Billion |
| Market Size by 2032 | USD 77.02 Billion |
| Growth Rate from 2023 to 2032 | CAGR of 3.5% |
| Base Year | 2022 |
| Forecast Period | 2023 to 2032 |
| Segments Covered | Type, Application |
| Regions Covered | North America, Europe, Asia-Pacific, Latin America and Middle East & Africa |
Growing ongoing research & development in the healthcare sector technologies for the stroke can create lucrative growth opportunities for the key players operating in the global market. In the developed countries such as U.S and Canada the healthcare treatment, service costs are relatively high owing to availability of advanced healthcare infrastructure. Due to the ongoing healthcare technology advancements highly sophisticated tools and apps are used every day, around the globe. Scientific and technical developments give rise to more powerful methods for disease prevention and recovery. Despite various technical advancements benefiting different medical fields, it's no wonder that such innovations often create waves in stroke management. In addition to defining and recognizing the symptoms of this disease, both IT and mobile health apps provide valuable resources to resolve the issues that occur in this field. Technology also benefits healthcare providers, and without complex procedures, patients can monitor their heart health. Advanced technology also assists with prevention, diagnosis, and recovery. Further, growth in emerging economies is another factor to creating growth opportunity for the key players in the global market.
The study report delivers prospects and trends of stroke diagnostic and therapeutic products across different geographical regions counting Europe, North America, Latin America, Asia-Pacific, Middle East, and Africa. However, geographically, the stroke diagnostic and therapeutic market is dominated by North America due to growing stroke patient’s pool in the countries U.S. and Canada, availability of advanced healthcare infrastructure, presence of key market players, and government initiatives that improve access to advanced power instruments the treatment of stroke in the North America. Europe constitutes a share more than 25% of the global in 2020. Presence of key operating players in the countries of the region is expected to help the development of the Europe market in the coming years of the forecast period ranging. Asia Pacific stroke diagnostics and therapeutics market is anticipated to grow at a CAGR of 8.4% over the forecast period. Increasing health awareness among the individuals in the emerging economies is expected to help in driving the growth of the global market in Asia Pacific region.
Some of the prominent players in the Stroke diagnostic and therapeutic Market include:
Segments Covered in the Report
This report forecasts revenue growth at global, regional, and country levels and provides an analysis of the latest industry trends in each of the sub-segments from 2018 to 2032. For this study, Nova one advisor, Inc. has segmented the global stroke diagnostic and therapeutic market.
By Type
By Application
By Region
Stroke Diagnostic and Therapeutic Market
