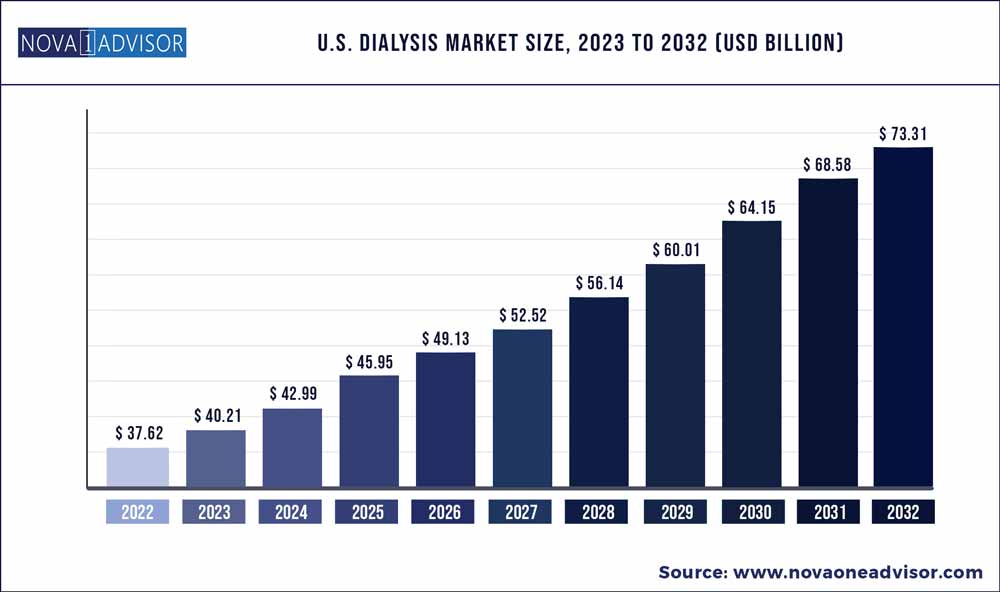
The U.S. Dialysis market size was exhibited at USD 37.62 billion in 2022 and is projected to hit around USD 73.31 billion by 2032, growing at a CAGR of 6.9% during the forecast period 2023 to 2032.
Key Pointers:
Report Scope of the U.S. Dialysis Market
|
Report Coverage |
Details |
|
Market Size in 2023 |
USD 40.21 Billion |
|
Market Size by 2032 |
USD 73.31 Billion |
|
Growth Rate from 2023 to 2032 |
CAGR of 6.9% |
|
Base Year |
2022 |
|
Forecast Period |
2023 to 2032 |
|
Segments Covered |
By Type, By Product and Services, By End-use |
The rise in geriatric population, increase in healthcare expenditure, and high disposable income. Moreover, surge in funding for the development of new products will provide a profitable scenario for the U.S. market.
Increasing burden of renal diseases in the U.S. is the key factor driving the market growth. The demand for dialysis therapy will increase as the elderly population are susceptible to chronic kidney disease (CKD) and end-stage renal disease (ESRD). Furthermore, favourable reimbursement scenario, technological advancements in dialysis products, together with improved healthcare facilities, will further boost the U.S. dialysis market sales.
The impact of COVID-19 on the U.S. dialysis industry is observed to be moderate. COVID-19 infection is majorly a respiratory disease, but it has also shown to affect kidneys as well, damaging the organ to cause an acute renal infection (AKI). Major players of the dialysis business ramped up their production. For instance, in 2020 amid pandemic Baxter increased the manufacturing of fluids and sets required in dialysis procedure.
The company provided CRRT machines, fluids and sets to help healthcare facilities to address patient needs globally. This ensured that the product shortage can be alleviated. Similarly, many medical device companies have doubled up their production and supply in response to the emerging needs of patient and healthcare sector.
Dialysis is used to remove waste products from the blood, such as urea and creatinine, that are produced when the kidneys do not work properly. People with chronic renal failure are benefited from the procedure. The procedure is most commonly used to treat end-stage renal illness and kidney transplantation. Blood is filtered, excessive fluids and toxins are eliminated, and electrolyte balance is maintained in the blood with the help of this procedure. Haemodialysis and peritoneal dialysis are the two types of dialysis available.
The shortage of kidney donors for transplantation in the U.S. continues to be a major issue. Every year, around many deceased donor kidneys are rejected due to anomalies discovered in procurement biopsies. Kidney transplant is a time-consuming surgery, and the kidney that is transplanted must be accurately examined to avoid post-transplant complications. There is often a danger of renal failure. As a result, the number of kidney donors has been steadily declining in recent years. This results in a significant dependence and need for dialysis therapy among patients.
According to Penn Medicine data, in the U.S. the shortage of kidneys for transplantation has emerged as public health crisis. Nearly 90,000 patients in the country are on waiting list for kidney transplants. However, only about 20,000 transplants are performed annually. Each year, around 5,000 people on the waiting list of transplants die without getting it. Thus, the shortage of kidney donors in the U. S. will have a favourable impact for dialysis market growth, as it will raise demand for dialysis therapy in the region.
Based on type, the U.S. dialysis market is divided into peritoneal dialysis and hemodialysis. Out of these two, the hemodialysis segment accounted for around 90% market share in 2022. The segmental growth is high as hemodialysis treatment helps to balance minerals including salt, calcium, and potassium, that helps to lower blood pressure. Additionally, hemodialysis uses arteriovenous (AV) fistula, as it is the standard vascular access used to access a person’s blood. And also requires lesser time compared to peritoneal dialysis.
Moreover, rising cases of chronic kidney disease will contribute towards the market expansion. For instance, according to the 2021 Centers for Disease Control and Prevention fact sheet, chronic kidney disease affects roughly 15% of the adult population, i.e., 37 million population in the U.S. This disease is primarily caused by diabetes and heart disease. As a result, rising diabetes cases and high blood pressure prevalence are expected to contribute the U.S. dialysis market share.
Based on product and services, the U.S. dialysis market is fragmented into equipment, consumables, and services. The consumables segment held over USD 6.2 billion in revenue size in 2022 and is poised to experience a high growth rate over the analysis timeframe. Consumables such as catheters offers maximum patient safety, enhancing the market expansion.
Similarly, tunneled hemodialysis catheters (a tunneled hemodialysis catheter is a special tube made of plastic used for hemodialysis treatment) offer uncomplicated and needle-free connection to the dialysis circuit and eliminates cannulation site complications and provide simple insertion technique that can be performed by many different interventional specialists. Furthermore, consumables such as dialyzers, blood tubes, access products, and other items have a greater replacement rate and are commonly utilised during hemodialysis therapy.
The U.S. dialysis market based on end-use is bifurcated into home dialysis and in-center dialysis. The home dialysis segment accounted for over 18.5% market share in 2022. People prefer home dialysis because it provides a higher quality of life, lower travel costs, more flexibility, and easier patient mobility. Further, elderly population with kidney disease prefers home dialysis treatment, that is anticipated to boost the overall market progression.
Some of the prominent players in the U.S. Dialysis Market include:
Segments Covered in the Report
This report forecasts the volume and revenue growth at the country level and provides an analysis of the latest industry trends in each of the sub-segments from 2018 to 2032. For this study, Nova one advisor has segmented the U.S. Dialysis market.
By Type
By Product and Services
By End-use
U.S. Dialysis Market
