U.S. Magnetic Resonance Imaging Market Size and Growth
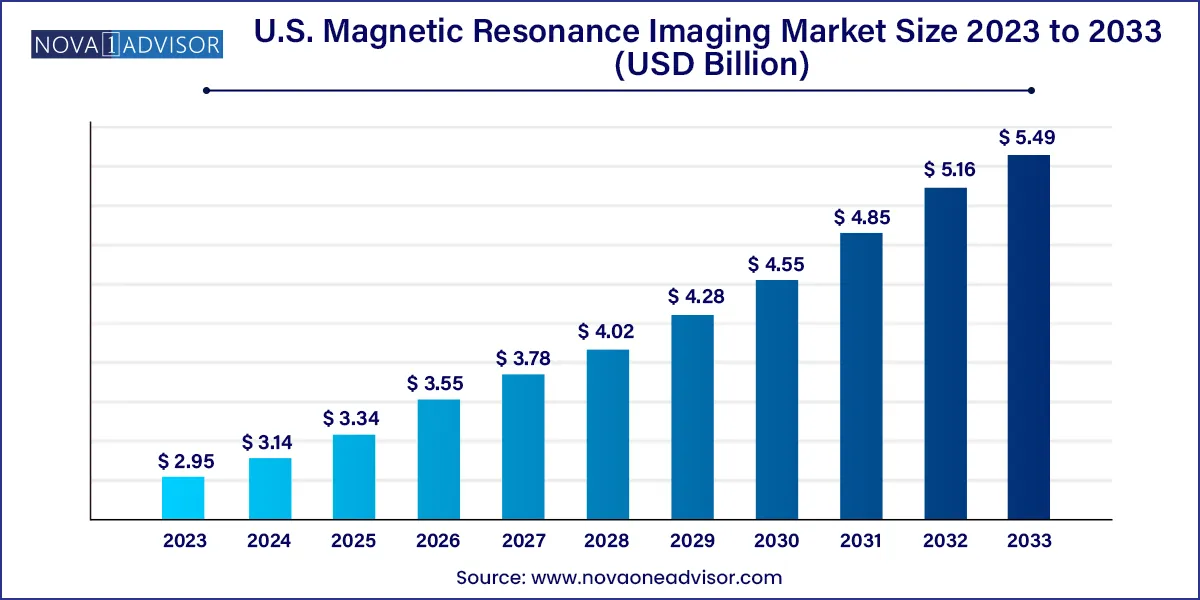
The U.S. magnetic resonance imaging market size was exhibited at USD 2.95 billion in 2023 and is projected to hit around USD 5.49 billion by 2033, growing at a CAGR of 6.4% during the forecast period 2024 to 2033.

Key Takeaways:
- The closed systems segment held the largest share of 71.0% in 2023.
- The open MRI systems showed the highest growth rate of 7.6% CAGR.
- The mid field strength accounted for the largest share of ~48.0% in the field strength segment.
- High field strength is expected to witness the highest CAGR of 7.6% during the forecast period.
- The brain and neurological segment accounted for the largest share of ~22.5% in 2023.
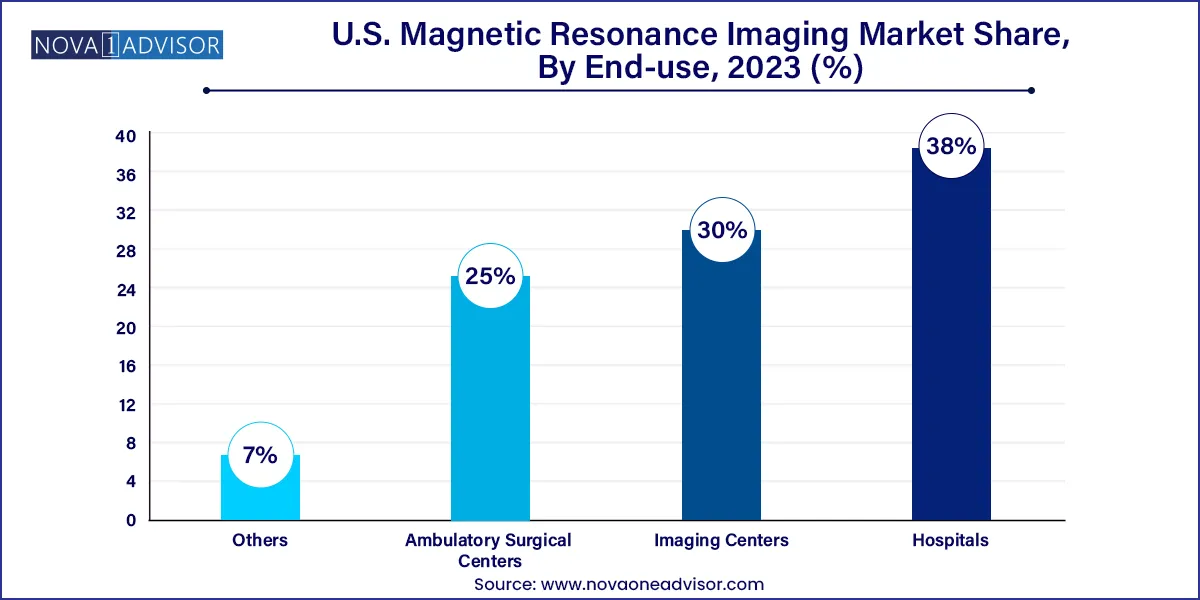
- The hospital segment accounted for the largest share of ~38.0% in the end-use segment.
U.S. Magnetic Resonance Imaging Market by Overview
The U.S. magnetic resonance imaging (MRI) market represents a critical segment of the country's medical imaging infrastructure, offering non-invasive, high-resolution diagnostic capabilities across a broad spectrum of clinical specialties. MRI technology is widely used to diagnose and monitor conditions related to the brain, spine, musculoskeletal system, cardiovascular health, and soft tissues, with increasing applications in oncology and sleep apnea as well. The U.S. healthcare system, known for its advanced medical technologies and widespread insurance coverage, provides fertile ground for the sustained expansion of MRI usage.
Growth in this market is driven by the rising burden of chronic diseases, increasing geriatric population, and the ongoing shift toward early detection and precision diagnostics. Moreover, the post-pandemic focus on healthcare modernization has led to strategic investments in hospital infrastructure, AI-enabled radiology systems, and ambulatory diagnostic centers. The market is further supported by a well-established regulatory framework and continuous innovations in MRI machine design, imaging speed, and patient comfort.
The U.S. MRI landscape is also evolving in response to patient-centric trends, such as noise reduction technology, shorter scan durations, and open architecture systems that cater to claustrophobic or bariatric patients. Technological innovations like 7T MRI for ultra-high-resolution imaging and portable MRI units for point-of-care diagnostics are reshaping the operational and clinical value proposition of MRI in the U.S. market.
U.S. Magnetic Resonance Imaging Market Growth Factors
The growth of the U.S. Magnetic Resonance Imaging (MRI) market is propelled by several key factors. Firstly, technological advancements in MRI systems, including higher magnetic field strength and improved imaging resolution, drive market expansion by enhancing diagnostic accuracy and efficiency. Secondly, favorable reimbursement policies for MRI procedures encourage healthcare providers to offer these services, contributing to market growth. Additionally, the increasing prevalence of chronic diseases necessitates the use of MRI for early detection and treatment planning, further fueling market demand. Moreover, the shift towards outpatient imaging centers for MRI services, driven by factors such as convenience and cost-effectiveness, expands market accessibility and utilization. These growth factors collectively underscore the promising trajectory of the U.S. MRI market."
Report Scope of The U.S. Magnetic Resonance Imaging Market
| Report Coverage |
Details |
| Market Size in 2024 |
USD 3.14 Billion |
| Market Size by 2033 |
USD 5.49 Billion |
| Growth Rate From 2024 to 2033 |
CAGR of 6.4% |
| Base Year |
2023 |
| Forecast Period |
2024-2033 |
| Segments Covered |
Architecture, Field Strength, Application, End-use |
| Market Analysis (Terms Used) |
Value (US$ Million/Billion) or (Volume/Units) |
| Regional Scope |
U.S. |
| Key Companies Profiled |
GE Healthcare; Siemens AG; Toshiba Corporation; Aurora Imaging Technologies, Inc.; Koninklijke Philips N.V.; Esaote SPA; Sanrad Medical Systems Pvt ltd.; Fujifilm |
Market Driver: Growing Use of MRI in Neurology and Oncology
A major driver propelling the U.S. MRI market is the expanding use of MRI in neurology and oncology. With neurodegenerative diseases like Alzheimer's and Parkinson's on the rise, MRI has become indispensable for early and differential diagnosis. Advanced techniques such as functional MRI (fMRI), diffusion tensor imaging (DTI), and magnetic resonance spectroscopy (MRS) offer unparalleled insight into brain activity, white matter integrity, and chemical composition.
In oncology, MRI is a key modality for staging tumors, planning treatment, and monitoring therapy response, especially in soft tissue malignancies like breast, brain, and prostate cancers. The superior contrast resolution and lack of ionizing radiation make MRI particularly valuable in repeat imaging protocols. As precision medicine gains traction in the U.S., the need for detailed anatomical and functional imaging is expected to grow, further boosting MRI utilization.
Market Restraint: High Installation and Maintenance Costs
Despite its clinical value, the adoption of MRI technology is often hampered by high capital expenditure and operating costs. The installation of an MRI suite requires significant investment not only in the equipment itself but also in infrastructure—shielding, cooling systems, power supply, and spatial design. For rural or budget-constrained healthcare providers, these costs can be prohibitive.
Moreover, MRI systems require routine calibration, high-cost cryogens for superconducting magnets, and specialized personnel for operation and maintenance. Reimbursement challenges, particularly for advanced imaging or repeat scans, add financial pressure to smaller imaging centers. These economic barriers can slow the penetration of newer technologies like 7T MRI and hinder access in underserved areas.
Market Opportunity: Rise of AI-Enhanced and Portable MRI Systems
The emergence of AI-enhanced MRI systems and portable MRI units presents a significant growth opportunity in the U.S. market. Artificial intelligence is being used to accelerate scan times, automate segmentation, improve image quality, and reduce motion artifacts. These improvements increase throughput and enhance diagnostic accuracy, making MRI more scalable for high-volume environments.
At the same time, compact and portable MRI units are opening new avenues for bedside imaging in ICUs, emergency rooms, and even in-home settings. Companies are developing low-field portable systems that offer sufficient image quality for specific applications like brain trauma or stroke assessment. These solutions are particularly valuable in remote or underserved regions, military medicine, and mobile health clinics.
U.S. Magnetic Resonance Imaging Market By Architecture Insights
Closed system MRI scanners dominate the U.S. market, offering superior image resolution and field strength. These systems are the gold standard for detailed anatomical and functional imaging, particularly in neurology, musculoskeletal, and vascular applications. The high signal-to-noise ratio of closed systems supports advanced imaging protocols, including spectroscopy and functional MRI. Despite concerns about patient discomfort, closed systems remain the preferred modality in hospitals and academic centers due to their diagnostic superiority.
Open system MRI scanners are the fastest-growing segment, driven by the need to improve patient comfort and accessibility. These systems are particularly beneficial for pediatric, geriatric, bariatric, and claustrophobic patients. Open MRIs are also commonly used in orthopedic imaging and pain management clinics. Technological advances have improved the resolution of open systems, narrowing the performance gap with closed MRI machines. Their increasing adoption in outpatient and ambulatory settings underscores their growing relevance in the U.S. market.
U.S. Magnetic Resonance Imaging Market By Field Strength Insights
Mid field strength MRI systems (1.5T) remain the dominant segment, as they offer a balance of diagnostic performance and cost-effectiveness. These systems are suitable for most clinical applications, including neuro, body, and musculoskeletal imaging. Their widespread use in both hospitals and imaging centers has made them the backbone of MRI services across the country. Continuous upgrades in software and coils have further enhanced the capability of 1.5T systems to meet evolving clinical demands.
High field strength MRI systems (3T and above) are the fastest-growing, especially in research centers, academic hospitals, and specialized diagnostic clinics. The higher signal strength enables faster scans, improved image clarity, and enhanced capabilities for advanced applications such as spectroscopy, fMRI, and cardiac imaging. As AI and noise-cancellation technologies make high-field systems more patient-friendly, their adoption is expected to accelerate in mainstream clinical practice.
U.S. Magnetic Resonance Imaging Market By Application Insights
Brain and neurological applications dominate the MRI market, owing to the growing incidence of stroke, multiple sclerosis, and neurodegenerative diseases. MRI is the imaging modality of choice for detailed brain mapping, tumor detection, and functional assessments. Techniques like fMRI and DTI are enabling cutting-edge research and clinical insights, particularly in academic and research hospitals.
Obstructive sleep apnea (OSA) and cardiac applications are the fastest-growing segments. MRI is increasingly being used to assess anatomical abnormalities associated with OSA and to study airway dynamics during sleep. In cardiology, MRI provides detailed information on myocardial perfusion, fibrosis, and ventricular function, making it a valuable tool for diagnosing ischemic and non-ischemic heart disease. The growing interest in non-invasive cardiac diagnostics is expected to boost this segment further.
U.S. Magnetic Resonance Imaging Market By End-use Insights
Hospitals remain the largest end-users of MRI systems, driven by their need for comprehensive diagnostic capabilities and multidisciplinary imaging demands. Tertiary and academic hospitals often house multiple MRI units and offer a wide range of applications, from emergency brain scans to oncology monitoring. Hospitals also benefit from integrated PACS systems and in-house radiology departments, allowing seamless data sharing and clinical decision-making.

Imaging centers and ambulatory surgical centers (ASCs) are the fastest-growing end-use segments. These settings offer quicker appointments, lower costs, and greater convenience for patients, making them attractive for elective and follow-up imaging. The shift toward decentralized care, combined with reimbursement incentives for outpatient imaging, is driving MRI equipment procurement in these settings. Mobile MRI units and leasing models are also enabling broader access across suburban and rural areas.
Country-Level Analysis: United States
The U.S. market for MRI is shaped by a mature healthcare ecosystem, favorable reimbursement policies, and a culture of early technology adoption. Major health systems and private practices alike rely heavily on MRI for clinical diagnosis, surgical planning, and disease monitoring. The U.S. leads in MRI scan volume per capita, supported by high patient awareness and broad insurance coverage.
Recent years have seen a strong push toward expanding MRI access beyond urban hospitals. Outpatient imaging centers are proliferating in suburban and rural areas, offering services such as same-day scans and AI-assisted interpretation. Additionally, U.S.-based companies are at the forefront of AI-driven MRI innovations, cloud-based image storage, and mobile diagnostic platforms. Federal investments in precision medicine and cancer diagnostics are further fueling MRI equipment procurement and software integration.
Some of the prominent players in the U.S. Magnetic Resonance Imaging Market include:
- GE Healthcare
- Siemens AG
- Toshiba Corporation
- Aurora Imaging Technologies, Inc.
- Koninklijke Philips N.V.
- Esaote SPA
- Sanrad Medical Systems Pvt ltd
- Fujifilm
Recent Developments
-
In March 2025, GE HealthCare launched its next-generation SIGNA Champion 3T MRI scanner with advanced AI-assisted protocols.
-
In February 2025, Siemens Healthineers received FDA approval for its MAGNETOM Free.Max portable MRI unit, enabling broader access to imaging in outpatient and rural settings.
-
In January 2025, Canon Medical Systems USA introduced its Vantage Fortian MRI platform, focusing on patient comfort and automation.
-
In November 2024, United Imaging Healthcare announced the expansion of its Houston facility to support increased demand for its high-field MRI systems.
-
In September 2024, Philips Healthcare released an upgrade to its Ingenia Elition platform, improving scan speed and reducing acoustic noise levels.
Segments Covered in the Report
This report forecasts revenue growth at country levels and provides an analysis of the latest industry trends in each of the sub-segments from 2021 to 2033. For this study, Nova one advisor, Inc. has segmented the U.S. Magnetic Resonance Imaging Market
Architecture
- Closed System
- Open System
Field Strength
- Low Field Strength
- Mid Field Strength
- High Field Strength
Application
- Obstructive Sleep Apnea (OSA)
- Brain And Neurological
- Spine And Musculoskeletal
- Vascular
- Abdominal
- Cardiac
- Breast
- Other
End-Use
- Hospitals
- Imaging Centers
- Ambulatory Surgical Centers
- Others


