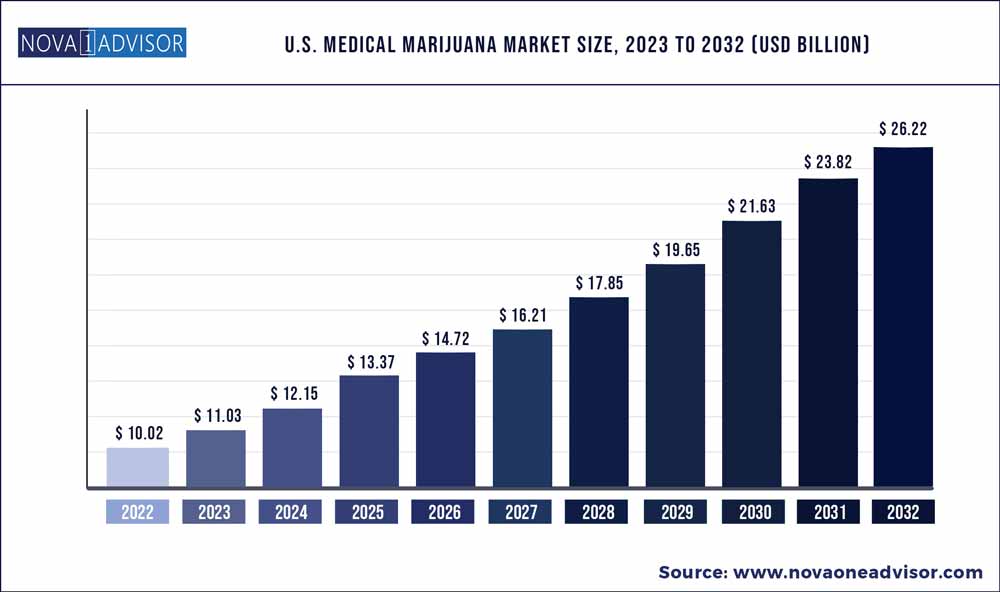
The U.S. medical marijuana market size was exhibited at USD 10.02 billion in 2022 and is projected to hit around USD 26.22 billion by 2032, growing at a CAGR of 10.1% during the forecast period 2023 to 2032.
Increasing awareness regarding the health benefits of cannabis and cannabidiol (CBD) to treat various clinical conditions will boost the market landscape. CBD is a non-impairing compound found in marijuana that does not induce euphoria. It has multiple health benefits including pain management, appetite enhancement, reduced eye pressure, and many more.
The United States Food and Drug Administration (FDA) encourages new drug development efforts and is steadily authorizing medicines containing therapeutic compounds derived from cannabis. The product could help treat patients of age one year and above with seizures caused by tuberous sclerosis complex (TSC).
| Report Coverage | Details |
| Market Size in 2023 | USD 3.66 billion |
| Market Size by 2032 | USD 5.45 billion |
| Growth Rate from 2023 to 2032 | CAGR of 4.5% |
| Base Year | 2022 |
| Forecast Period | 2023 to 2032 |
| Segments Covered | Application, Route of Administration, Distribution Channel |
| Companies Covered | Aurora Cannabis, Inc., GW Pharmaceuticals, Cannabis Sativa, Inc., Emerald Health Therapeutics Inc., The Cronos Group Inc., Tilray, Lexaria Bioscience Corp, Curaleaf, Green Roads, CHARLOTTE’S WEB, Canopy Growth Corporation, Gaia Herbs, Medical Marijuana, and Folium Biosciences |
Strict federal laws against cannabis production in some states may impede industry across the U.S. As per federal law, cannabis remains illegal and banks in the U.S. are under strict compliance with the government to avoid taking funds from marijuana businesses. The lack of a policy framework pertaining to the production and sale of marijuana in many parts of the country may hinder the U.S. medical marijuana market forecasts.
U.S. medical marijuana market from pain management segment was over USD 9 billion in 2022. Rising incidences of neuropathic and chronic pain cases in the U.S. has accelerated the need for novel therapeutic options. According to data provided by the CDC, more than 21% of American adults live with chronic pain. Marijuana is seen as a potential alternative to traditional chronic pain medication.
Studies suggest that medical marijuana may be a good treatment option for people with fibromyalgia as it contains compounds that could offer relief from some of its symptoms. Patients of fibromyalgia may experience pain and headaches along with several other indications. Government efforts to legalize the substance for medical purposes will enable its use in the production of novel chronic pain medications.
In terms of the distribution channel, the U.S. medical marijuana market is bifurcated into dispensaries, and online platforms. The dispensaries segment is projected to exhibit a 10.1% CAGR between 2023-2032. Several U.S. states are allowing patients to purchase medical marijuana products from authorized local dispensaries. Authorized procurement and sale of cannabis-infused medical products helps the local governments to effectively check whether the distribution is performed legally. Increasing initiatives in favor of marijuana legalization will enable the deployment of authorized dispensaries in the country.
South Atlantic U.S. medical marijuana market is poised to surpass USD 3 billion by 2030. Significant progress in the patient population across the state will fuel the demand for suitable CBD products. A favorable licensing scenario is accelerating cannabis production across South Atlantic. Increasing awareness regarding the health benefits of the substance will further drive the sales of medical marijuana across South Atlantic U.S.
Some of the prominent players in the U.S. medical marijuana Market include:
Aurora Cannabis, Inc., GW Pharmaceuticals, Cannabis Sativa, Inc., Emerald Health Therapeutics Inc., The Cronos Group Inc., Tilray, Lexaria Bioscience Corp, Curaleaf, Green Roads, CHARLOTTE’S WEB, Canopy Growth Corporation, Gaia Herbs, Medical Marijuana, and Folium Biosciences. These companies are focusing on product commercialization and patents by means of collaboration with related firms.
Segments Covered in the Report
This report forecasts the volume and revenue growth at the country level and provides an analysis of the latest industry trends in each of the sub-segments from 2018 to 2032. For this study, Nova one advisor has segmented the U.S. medical marijuana market.
By Application
Pain Management
Neuropathic Pain
Cancer Pain
Others
Muscle Spasms
Nausea
Anorexia
Seizures
Others
By Route of Administration
Inhalation
Oral
Topical
By Distribution Channel
Dispensaries
Online
U.S. Medical Marijuana Market
