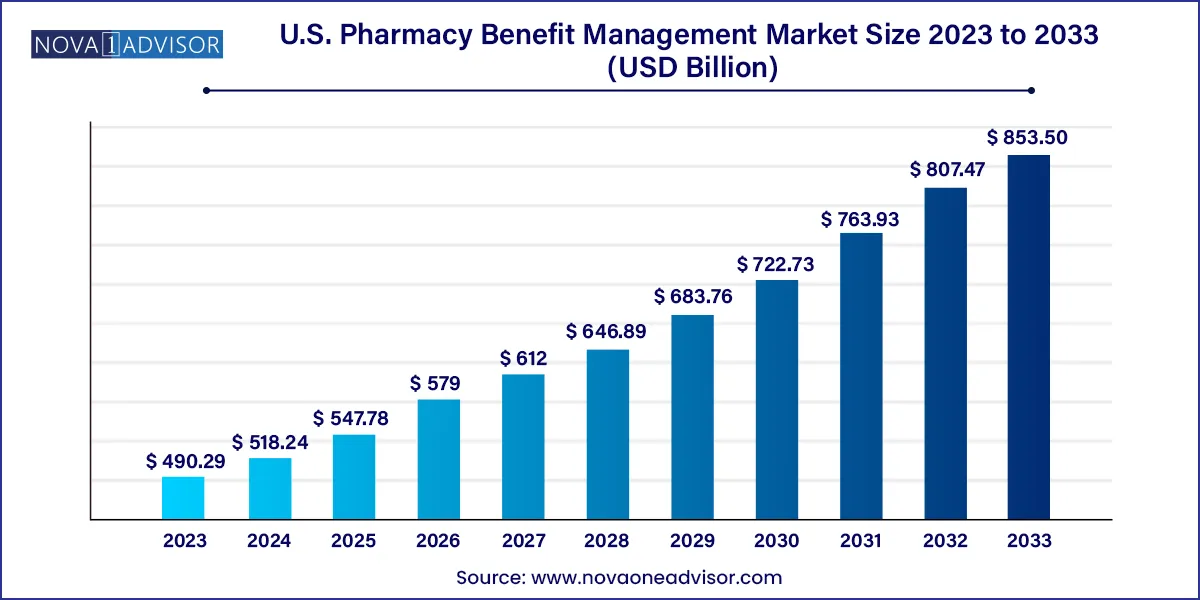
The U.S. pharmacy benefit management market size was estimated at USD 490.29 billion in 2023 and is expected to be worth around USD 853.50 billion by 2033, poised to grow at a compound annual growth rate (CAGR) of 5.7% during the forecast period 2024 to 2033.

U.S. Pharmacy Benefit Management Market Key Takeaways
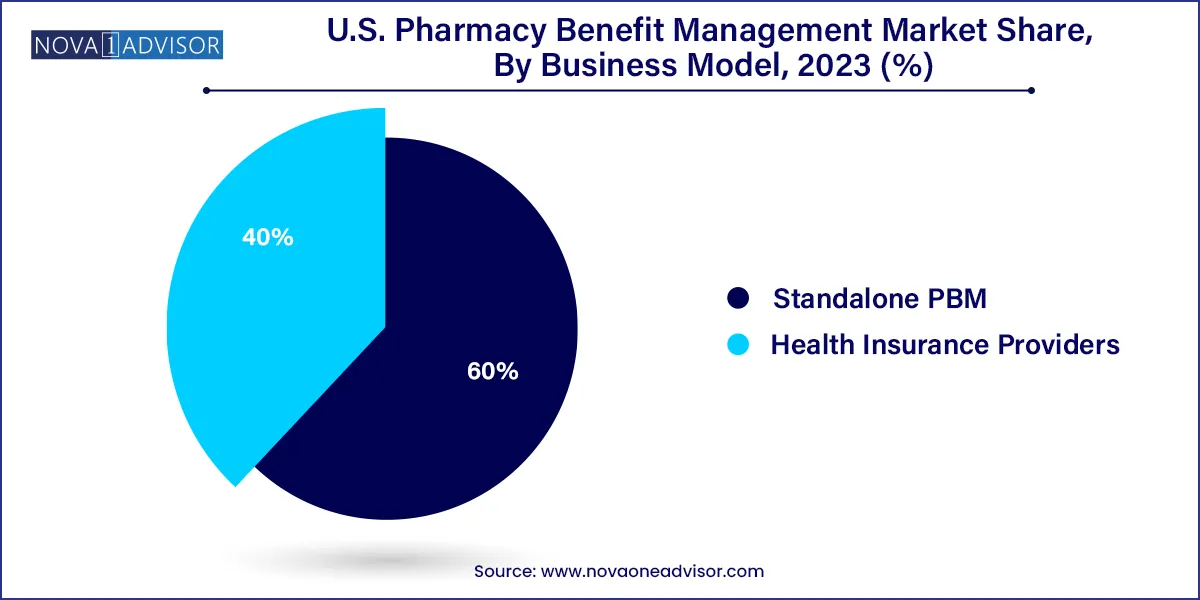
- By Business Model, the standalone PBM segment dominated the market with the largest market share of 60% in 2023.
- By Business Model, the healthcare insurance provider segment is expected to generate significant revenue throughout the forecast period.
- By Services, the specialty pharmacies segment dominated the market in 2022.
- By Services, the retail services segment is expected to witness significant growth during the predicted timeframe.
- By End-user, the commercial segment projected the highest market growth in 2022.
- By End-user, the federal segment is expected to dominate the market during the anticipated time.
U.S. Pharmacy Benefit Management Market Growth Factors
The rise in healthcare spending has had a significant impact on the market's growth. Aside from that, the rising prevalence of chronic illnesses and a growing tendency for vertical integration within pharmaceutical distribution networks have boosted the industry in the country.
Pharmacy benefit managers serve as liaisons between insurance companies and pharmaceutical producers. According to the National Association of Insurance Commissioners, there are around 66 PBM businesses operating in the United States, handling the pharmacy benefits of over 266 million Americans. PBM (pharmacy benefit management) services are in high demand as the number of insurance providers having in-house pharmaceutical benefit groups to manage the insured population grows. PBM systems reduce total costs by integrating health plan consumers into larger networks that allow for negotiations and discounts.
Vertical integration is driving market growth, particularly in the aftermath of CVS-Aetna and Cigna-Express Scripts mergers. The supply chain dynamics are expected to shift significantly in the next years, particularly following these mergers. Partnerships between PBM organizations and health insurance companies are expected to boost market growth and PBMs' participation in decision-making. Such market partnerships would increase the price and personalization of health insurance policies, as well as provide more options by aligning with healthcare providers.
The majority of pharmaceuticals on the market have identical mechanisms of action, resulting in minor differences between APIs, increasing the price sensitivity of these medications. PBMs release prescription formularies that include all drugs covered by their benefit plans, and manufacturers are willing to provide discounts. Manufacturers who include their medications on the PBM formulary list considerably compensate PBMs. Prior-authorization rules give PBMs more power over prescribing decisions, potentially allowing them to interrupt patient treatments.
U.S. Pharmacy Benefit Management Market Report Scope
| Report Attribute |
Details |
| Market Size in 2024 |
USD 518.24 Billion |
| Market Size by 2033 |
USD 853.50 Billion |
| Growth Rate From 2024 to 2033 |
CAGR of 5.7% |
| Base Year |
2023 |
| Forecast Period |
2024 to 2033 |
| Segments Covered |
By Business Model, By Service, and By End-user |
| Market Analysis (Terms Used) |
Value (US$ Million/Billion) or (Volume/Units) |
| Report Coverage |
Revenue forecast, company ranking, competitive landscape, growth factors, and trends |
| Key Companies Profiled |
CVS Health, Cigna, Optum, Inc., MedImpact, Anthem, Change Healthcare, Prime Therapeutics LLC, HUB International Limited., Elixir Rx Solutions LLC, and Others. |
U.S. Pharmacy Benefit Management Market Dynamics:
Driver:
Increasing medication accessibility
Access to medical services in the United States is facilitated by making sure that the medications are both affordable and safe. Patients who receive individualized care may also feel secure enough to take their prescribed drugs without being concerned about the expense or course of their care. In keeping with a tailored strategy, PBMs can work with companies to offer insightful counsel on efficient health plans. The objective of this activity is to deliver the greatest care at the most affordable cost. These groups can also seek approaches to increase the availability of specialist medications for individuals who require them.
The increasing accessibility to medication can drive the growth of the market by expanding the customer base and increasing the volume of prescriptions processes. This could lead to greater demand for PBM services as more individuals gain access to healthcare and pharmaceuticals. Additionally, a larger patient population could lead to increased negotiations with drug manufacturers for better pricing, which PBMs facilitate, further contributing to the market’s growth.
Restraint:
Lack of transparency
Due to the difficulties with pharmaceutical benefit managers, there is a discussion on the transparency of PBM activities. PBMs assert that they are in a good position to save plans and customers money, but because their business practices are opaque, they are frequently able to utilize their clout to increase their profits at the expense of the customer. This has prompted policymakers to consider changing the rebate system by requiring PBMs to pass along more rebate savings or increasing transparency. The lack of transparency in the market acts as a restraint by making it difficult for stakeholders, such as patients, employers and even for healthcare providers. This lack of visibility into pricing mechanisms and negotiations between PBMs and pharmaceutical manufacturers can hinder competition and potentially lead to higher healthcare costs for consumers.
Opportunity:
Integration of digital treatment program
The expanded use of evidence-based digital treatment programs to treat chronic illnesses is one area of digital health that, driven by customer demand. It is essential to change behavior in order to enhance employee health outcomes and to offer tried-and-true software, applications, and other digital technologies to assist people in managing and treating a wide range of illnesses. Offering digital treatment programs that are supported by clinical research and recognized by regulatory agencies can result in fewer complications or hospitalizations as well as lower healthcare expenditures for both the employee and the plan sponsor.
The integration of digital treatment programs in the United States pharmacy benefit management market is observed to present multiple opportunities as it offers several benefits such as personalized patient care, better medication adherence and better management of chronic conditions. These programs can enhance patient engagement, monitor medication usage and offer real-time data to healthcare providers, leading to more effective and efficient treatment outcomes. As a result, PBMs can leverage these digital solutions to optimize medication management, control costs and enhance patient well-being, thereby influencing the growth of the market.
U.S. Pharmacy Benefit Management Market Business Model Insights
Health Insurance Providers dominated the PBM market by business model, primarily due to vertical integration strategies that allow them to manage benefits across the healthcare continuum. Companies like CVS Health (through Caremark) and UnitedHealth Group (through OptumRx) exemplify this model, where payers control everything from insurance to pharmacy to distribution. This alignment allows for tighter cost control, better data integration, and a more streamlined member experience. It also helps to avoid fragmentation, ensuring consistency in formulary application, rebate negotiation, and clinical program execution.

Standalone PBMs, while declining in overall market share, are experiencing rapid innovation and competitive agility, particularly among new entrants who champion transparency and tech-enabled service models. Companies like Navitus and Capital Rx are challenging legacy PBMs by offering pass-through pricing, algorithm-driven formularies, and real-time cost transparency for patients. While they may not yet match the scale of integrated players, their ability to attract self-insured employers, unions, and regional health plans is contributing to their accelerated growth and market diversification.
By Service
Specialty Pharmacy services led the market in 2024, driven by the increasing number of biologics, gene therapies, and high-cost medications requiring specialized handling. PBMs have expanded their infrastructure to support patients with chronic or complex conditions, offering personalized support, patient education, and adherence monitoring. For instance, CVS Specialty and Accredo (Cigna's Express Scripts arm) provide dedicated pharmacist consultations, home delivery, and 24/7 care teams, ensuring a high level of patient engagement and therapeutic success.
Retail Pharmacy services are emerging as the fastest-growing category within PBMs, especially with the renewed emphasis on community health and accessibility. PBMs are integrating retail offerings by partnering with or owning pharmacy chains, offering in-store prescription fulfillment, vaccinations, and chronic care services. Mail-order pharmacies and digital prescription transfers are further amplifying this segment, particularly in post-pandemic healthcare models that favor contactless services and home medication delivery.
By End-User
Commercial users, including self-insured employers and private insurers, dominated the PBM market, owing to their large enrollee base and greater control over benefit design. These users rely on PBMs to tailor formulary structures, negotiate rebates, manage utilization, and improve employee satisfaction through lower out-of-pocket drug costs. Fortune 500 companies frequently engage PBMs under performance-based contracts, requiring both financial and clinical transparency.
Federal end-users, especially Medicare and Medicaid plans, are growing swiftly, as the government continues outsourcing pharmacy benefit management to private PBMs. Medicare Part D alone covers millions of Americans and is managed by private entities that subcontract PBMs to process claims, manage formularies, and ensure medication adherence. With rising enrollment in Medicare Advantage and Medicaid managed care plans, this segment offers strong future growth potential, contingent upon regulatory oversight and public trust.
Country-Level Analysis – United States
In the United States, the PBM landscape is defined by a mix of large integrated giants and niche innovators. States like California, Texas, and New York have high concentrations of PBM activity due to their population size and dense health system networks. The U.S. Department of Health and Human Services continues to explore PBM roles in price-setting transparency, especially in Medicaid drug rebate programs and the 340B drug pricing program.
In addition to federal scrutiny, multiple state legislatures have introduced PBM regulatory frameworks addressing pharmacy audits, anti-steering policies, and transparency requirements. For example, Arkansas’ 2019 law requiring PBMs to reimburse pharmacies fairly was upheld by the U.S. Supreme Court, setting a precedent for further state-level interventions.
The rise of digital health and telepharmacy in rural states like Wyoming and Montana also underscores PBMs’ evolving role in expanding access, particularly in underrepresented areas. Meanwhile, employer coalitions such as the National Business Group on Health are pushing for transparent contracts, incentivizing PBMs to refine their offerings and justify their economic value.
U.S. Pharmacy Benefit Management Market Recent Developments:
-
In March 2025, CVS Health announced its expansion of Caremark’s CostVantage program, enabling pass-through pricing for a broader range of employer clients and integrating AI-based cost forecasting tools.
-
In February 2025, Cigna’s Evernorth introduced a new value-based contracting model through Express Scripts, linking drug payments to patient-reported outcomes for select specialty drugs.
-
In January 2025, Capital Rx raised $100 million in Series C funding to expand its pharmacy cloud platform and transparent PBM services to small and mid-sized businesses across the U.S.
-
In December 2024, Navitus Health Solutions entered a strategic partnership with Walmart Health to streamline retail pharmacy claims and improve medication adherence using real-time data tracking.
-
In November 2024, OptumRx launched its Optum Specialty Fusion platform, which consolidates medical and pharmacy benefits for specialty drugs into a single reimbursement stream to reduce duplicative costs.
U.S. Pharmacy Benefit Management Market Top Key Companies:
- CVS Health
- Cigna
- Optum, Inc.
- MedImpact
- Anthem
- Change Healthcare
- Prime Therapeutics LLC
- HUB International Limited.
- Elixir Rx Solutions LLC
U.S. Pharmacy Benefit Management Market Report Segmentation
This report forecasts revenue growth at country levels and provides an analysis of the latest industry trends in each of the sub-segments from 2021 to 2033. For this study, Nova one advisor, Inc. has segmented the U.S. Pharmacy Benefit Management market.
By Business Model
- Standalone PBM
- Health Insurance Providers
By Service
- Specialty Pharmacy
- Retail Pharmacy
By End-user


