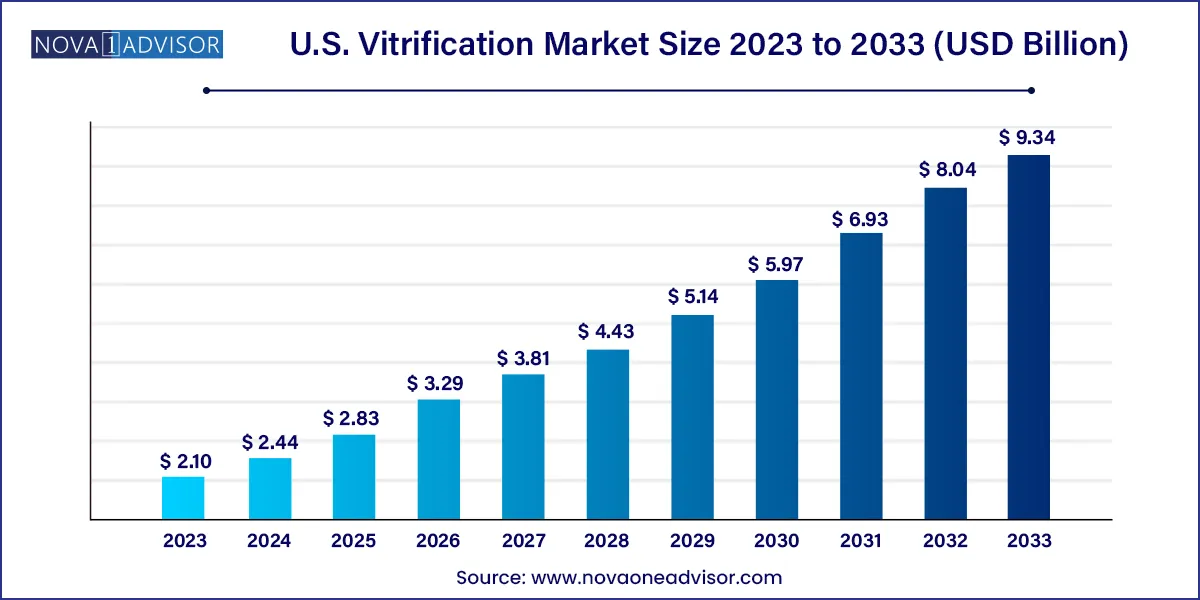
The U.S. vitrification market size was valued at USD 2.10 billion in 2023 and is projected to surpass around USD 9.34 billion by 2033, registering a CAGR of 16.09% over the forecast period of 2024 to 2033.

Key Takeaways:
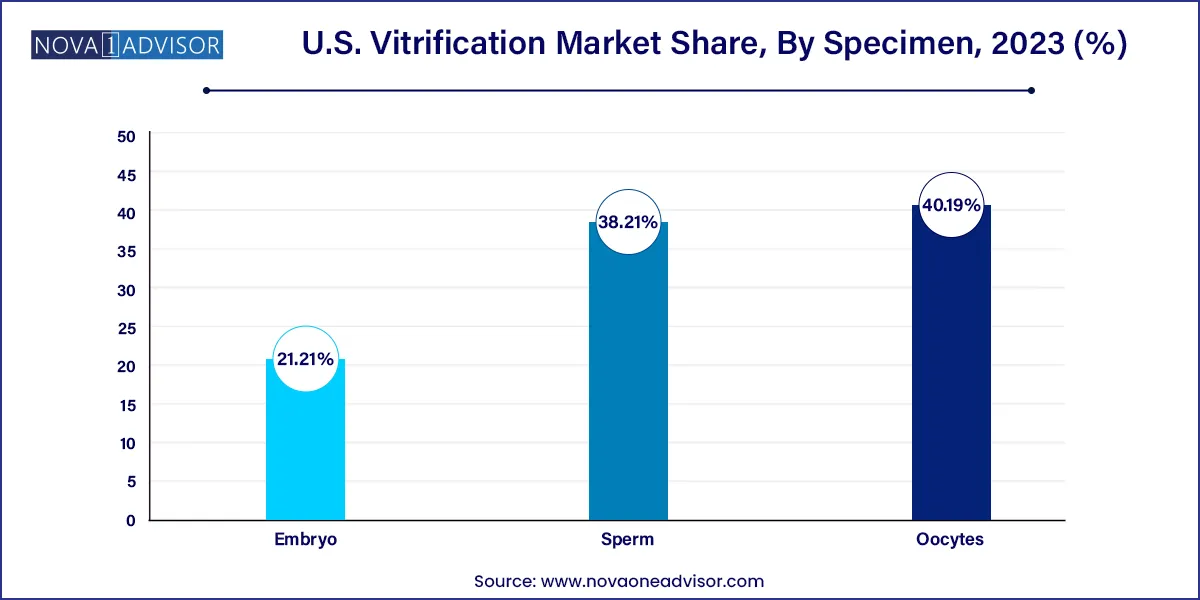
- Oocytes led the segment in 2023 with over 40.19% of the total revenue share.
- The sperm segment is anticipated to register the fastest CAGR over the forecast period.
- In 2023, IVF Clinics led the market by occupying nearly 60% of the total revenue generated.
- Biobanks are anticipated to grow at the fastest rate from 2024 to 2033.
Market Overview
The U.S. vitrification market is evolving as a critical component within the assisted reproductive technology (ART) and cryopreservation landscape. Vitrification is a method of ultra-rapid cryopreservation that converts biological samples such as oocytes, embryos, and sperm into a glass-like solid state without ice crystal formation. This method offers significantly higher survival rates post-thaw compared to traditional slow-freezing techniques and has become the gold standard in modern fertility treatments and biobanking.
Vitrification has revolutionized fertility preservation by increasing the efficiency and safety of freezing reproductive cells. The U.S. fertility industry, which has seen exponential growth in in vitro fertilization (IVF) cycles and elective egg freezing, relies heavily on vitrification protocols for gamete and embryo storage. The ability to preserve fertility in cancer patients, individuals undergoing gender transition, and women choosing to delay childbearing has brought vitrification into mainstream medical and social practices.
Additionally, the market is influenced by evolving consumer behaviors, increasing awareness of reproductive health, and expanding insurance coverage for fertility treatments in several U.S. states. The adoption of vitrification is further supported by improvements in vitrification kits, cryoprotectants, and devices, along with the growth of biobanks and stem cell repositories.
A surge in clinical trial activity, public-private partnerships, and fertility tourism further underscores the strategic significance of vitrification in the U.S. healthcare framework. Innovations in device miniaturization, digital traceability, and automation are set to expand market accessibility and precision. As a result, the vitrification market in the U.S. is projected to remain on a robust growth trajectory over the next decade.
Major Trends in the Market
-
Rise in Elective Fertility Preservation: Increasing numbers of women are freezing their oocytes for social reasons, driving demand for vitrification.
-
Integration of Artificial Intelligence (AI) in Cryopreservation: AI is being explored to automate vitrification timing and improve sample viability predictions.
-
Miniaturization of Vitrification Devices: More compact, ergonomic, and user-friendly devices are entering IVF clinics and labs.
-
Improved Vitrification Kits with Reduced Cryoprotectant Toxicity: New formulations aim to preserve viability while minimizing cellular toxicity during the freezing process.
-
Surge in Biobank Participation: Expansion of fertility-focused and general biobanks storing reproductive specimens.
-
Same-Sex and Single-Parent Family Planning: Growth in LGBTQ+ family planning is contributing to rising gamete and embryo preservation.
-
Oncofertility Advancements: Vitrification is increasingly being adopted for patients undergoing gonadotoxic treatments like chemotherapy or radiation.
-
Regenerative Medicine Applications: Vitrification of stem cells and tissues for therapeutic research is expanding.
-
Digital Labeling and Sample Tracking: Improved traceability and documentation for stored specimens, reducing loss and identity mismatch.
-
Expansion of Male Fertility Services: Rising awareness of male fertility health has bolstered sperm vitrification use.
U.S. Vitrification Market Report Scope
| Report Attribute |
Details |
| Market Size in 2024 |
USD 2.44 Billion |
| Market Size by 2033 |
USD 9.34 Billion |
| Growth Rate From 2024 to 2033 |
CAGR of 16.09% |
| Base Year |
2023 |
| Forecast Period |
2024 to 2033 |
| Segments Covered |
Specimen, end-use |
| Market Analysis (Terms Used) |
Value (US$ Million/Billion) or (Volume/Units) |
| Report Coverage |
Revenue forecast, company ranking, competitive landscape, growth factors, and trends |
| Key Companies Profiled |
Cook Medical LLC; Vitrolife; Genea Biomedx; NidaCon International AB; Minitube; IMV Technologies Group (Cryo Bio System); The Cooper Companies, Inc. (A CooperSurgical Fertility Company); FUJIFILM Corporation (FUJIFILM Irvine Scientific); Biotech, Inc.; Kitazato Corporation; Shenzhen VitaVitro Biotech
|
Market Driver: Rising Demand for Assisted Reproductive Technologies (ART) and Fertility Preservation
One of the primary drivers of the U.S. vitrification market is the rapidly growing demand for ART and fertility preservation solutions, especially among women choosing to delay childbirth for personal or professional reasons. According to the CDC, IVF procedures in the U.S. have been steadily increasing, with over 330,000 ART cycles performed annually.
Traditional cryopreservation methods posed challenges due to ice crystal formation, leading to low survival rates and poor embryo viability. Vitrification overcomes this limitation, offering close to 90% survival rates for oocytes and embryos. This level of efficacy is critical for patients undergoing egg freezing prior to chemotherapy, transgender individuals preserving reproductive material, and couples choosing elective embryo storage.
The broadening age range of fertility patients, legislative changes around gamete storage, and the commercialization of fertility services in the U.S. are making vitrification not only a medical necessity but a lifestyle choice. As fertility services become more integrated into healthcare offerings and insurance programs, vitrification stands to benefit immensely from increased patient volumes and clinical applications.
Market Restraint: High Procedural Costs and Regulatory Complexity
Despite its effectiveness, the high cost of vitrification procedures and associated regulatory nuances pose a significant barrier to wider adoption, particularly among middle-income individuals and smaller IVF practices. Vitrification involves the use of high-quality cryoprotectants, precise lab equipment, and trained embryologists—all of which contribute to high service fees.
Costs for egg freezing (including retrieval, vitrification, and storage) can exceed $10,000 per cycle, and insurance coverage varies widely by state and employer. Furthermore, ongoing storage costs at biobanks can become burdensome for patients over time. Smaller IVF centers and clinics may struggle to maintain optimal vitrification standards due to resource constraints, resulting in variable service quality.
Regulatory issues around storage duration, disposal, and informed consent especially concerning embryo preservation add legal and ethical complexity. This is particularly relevant in cases of divorce or donor-based reproduction. These factors collectively create uncertainty and hinder the mass democratization of vitrification services in the U.S. market.
Market Opportunity: Expansion of Biobanking and Stem Cell Research Applications
A substantial growth opportunity in the U.S. vitrification market lies in the expansion of biobanking and regenerative medicine research, where vitrification plays a central role in preserving tissue samples, oocytes, embryos, sperm, and stem cells.
The U.S. is home to numerous public and private biobanks that store biological specimens for future use in reproductive health, oncology, and chronic disease therapies. Vitrification enables long-term preservation of viable cell lines and gametes, facilitating not just fertility treatments but also disease modeling and genetic studies.
Emerging areas such as organoid generation, induced pluripotent stem cells (iPSCs), and personalized medicine require cryopreservation of biological specimens. As research institutions and pharmaceutical companies deepen their focus on precision medicine and cell-based therapies, demand for high-viability sample storage through vitrification is expected to rise.
Additionally, the U.S. government’s funding for NIH-supported biobanking programs and investments in translational medicine offer commercial and academic players fertile ground to expand vitrification technology use beyond ART and into therapeutic domains.
U.S. Vitrification Market Specimen Insights
Oocyte vitrification currently dominates the specimen segment, particularly due to the rising trend in social egg freezing and oncofertility treatments. Women are increasingly choosing to preserve their fertility in their 20s and early 30s due to delayed family planning. Additionally, advancements in oocyte vitrification protocols have significantly improved post-thaw viability and fertilization rates, making it a widely accepted procedure in IVF clinics.
Within the oocyte segment, kits and consumables represent a larger share of revenue compared to devices, as repeat procedures and disposables such as cryoprotectants, vitrification solutions, and labeling tools are regularly consumed per cycle. These products are essential for every vitrification event and must meet strict quality standards, ensuring consistent market demand.

Embryo vitrification is the fastest-growing segment, primarily due to the increasing use of preimplantation genetic testing (PGT) and embryo banking strategies in IVF. Embryo freezing allows patients to delay implantation for medical or elective reasons and supports multiple IVF attempts from a single stimulation cycle. Clinics are favoring embryo storage after blastocyst development, leading to increased use of vitrification protocols. Devices such as specialized embryo carriers and programmable freezers are gaining popularity alongside disposable kits optimized for embryo preservation.
Sperm vitrification, although a smaller segment in terms of volume and revenue, is growing steadily due to increasing awareness of male infertility, testicular cancer preservation, and elective sperm banking among military personnel, transgender individuals, and sperm donors.
U.S. Vitrification Market By End-use Insights
IVF clinics are the largest end-users in the U.S. vitrification market, as they serve as the primary touchpoint for patients undergoing fertility preservation and ART. These clinics rely on vitrification technology for gamete preservation, embryo freezing, and donor program management. The presence of thousands of IVF clinics across the country and their need for accurate, viable sample preservation makes them the top consumers of vitrification solutions.
Biobanks represent the fastest-growing end-use segment, owing to the increasing value of biological sample storage for future therapeutic and diagnostic purposes. These facilities cater to a broader audience, including academic institutions, pharmaceutical researchers, and long-term fertility planners. With NIH and private sector investments in biobanking and stem cell repositories, demand for reliable vitrification technologies has expanded significantly. Moreover, long-term contracts and subscription-based storage plans are creating stable revenue streams for vitrification kit and equipment providers.
Country-Level Analysis
The U.S. stands at the forefront of vitrification innovation and adoption, driven by a well-established IVF industry, favorable healthcare infrastructure, and a proactive biobanking environment. Leading fertility centers, such as those affiliated with the Society for Assisted Reproductive Technology (SART), routinely adopt vitrification as their preferred preservation method due to its efficacy and reliability.
The regulatory oversight from bodies such as the FDA, CDC, and state health departments ensures that clinics and biobanks adhere to stringent quality standards. Furthermore, many U.S. states now mandate fertility treatment coverage in employer-sponsored health plans, expanding patient access to elective oocyte and embryo freezing.
Universities and biotech companies are investing in cryogenic research, further integrating vitrification into areas such as cancer treatment, transplant medicine, and cell therapy. This cross-disciplinary application landscape makes the U.S. market both deep and diversified, reinforcing its global leadership in vitrification technologies.
U.S. Vitrification Market Recent Developments
-
March 2025: Vitrolife AB, a key supplier to U.S. IVF clinics, launched a new line of low-toxicity vitrification kits designed to preserve blastocyst integrity over extended periods.
-
February 2025: Origio (part of CooperSurgical) announced FDA clearance for its upgraded embryo vitrification carriers, optimized for automated sample tracking.
-
January 2025: Kindbody, a rising fertility clinic network in the U.S., expanded its cryopreservation facilities in Texas and California, citing growing demand for elective egg freezing.
-
December 2024: TMRW Life Sciences implemented its fully automated cryostorage management system at several leading U.S. fertility centers, enhancing sample traceability.
-
November 2024: Researchers at NYU Langone Fertility Center published new evidence on extended embryo culture techniques paired with vitrification, improving IVF success rates by over 15%.
U.S. Vitrification Market Top Key Companies:
- Cook Medical LLC
- Vitrolife
- Genea Biomedx
- NidaCon International AB
- Minitube
- IMV Technologies Group (Cryo Bio System)
- The Cooper Companies, Inc. (A CooperSurgical Fertility Company)
- FUJIFILM Corporation (FUJIFILM Irvine Scientific)
- Biotech, Inc.
- Kitazato Corporation
- Shenzhen VitaVitro Biotech
U.S. Vitrification Market Report Segmentation
This report forecasts revenue growth at country levels and provides an analysis of the latest industry trends in each of the sub-segments from 2021 to 2033. For this study, Nova one advisor, Inc. has segmented the U.S. Vitrification market.
By Specimen
- Oocytes
- Devices
- Kits & Consumables
- Embryo
- Devices
- Kits & Consumables
- Sperm
By End-use


