U.S. Cell Therapy Market Size and Growth 2026 to 2035
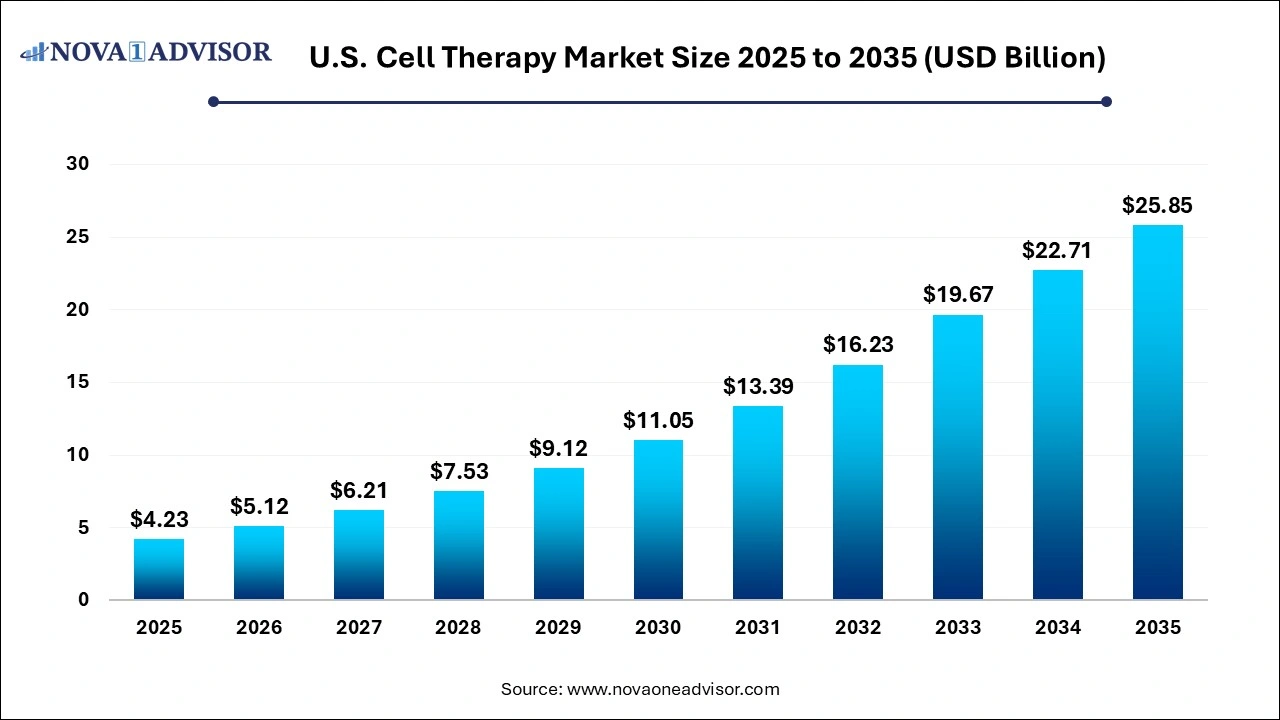
The U.S. cell therapy market size was estimated at USD 4.23 billion in 2025 and is projected to hit around USD 25.85 billion by 2035, growing at a CAGR of 19.84% during the forecast period from 2026 to 2035.

Key Takeaways:
- Autologous therapies segment dominated the market with a share of 91.9% in 2025.
- Allogenic therapies segment is projected to witness growth at the largest CAGR from 2026 to 2035.
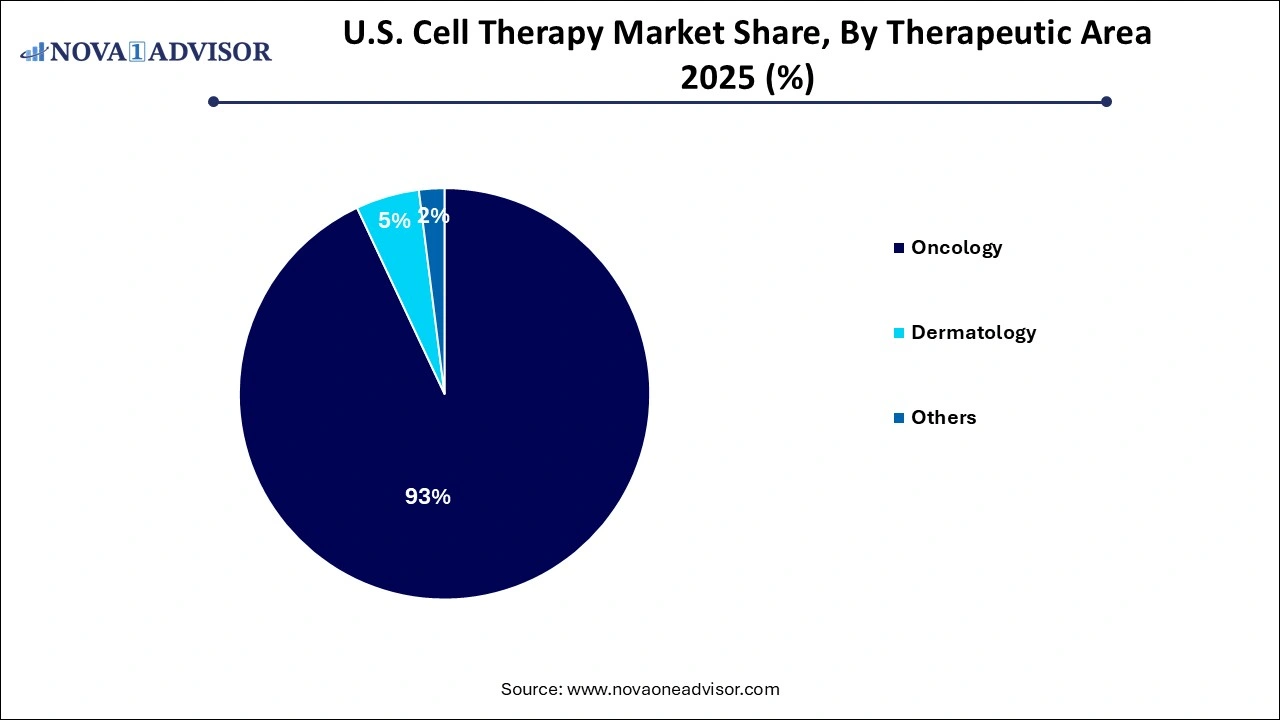
- The oncology segment held the market with a share of 92.5% in 2025.
- The dermatology segment is anticipated to grow at a significant CAGR from 2026 to 2035
U.S. Cell Therapy Market Overview
The U.S. cell therapy market has emerged as one of the most dynamic and rapidly evolving sectors in modern healthcare, driven by breakthroughs in regenerative medicine, immunotherapy, and personalized treatment. Cell therapy involves the administration of live cells into a patient’s body to repair, replace, or regenerate damaged tissue or to combat diseases such as cancer. With advancements in cell engineering, gene editing, and tissue regeneration, the market is redefining possibilities for diseases that were once considered incurable or difficult to treat.
Cell therapy in the United States spans a wide range of applications, including oncology, dermatology, orthopedics, neurology, and autoimmune disorders. In oncology alone, CAR-T therapies like Kymriah and Yescarta have revolutionized the treatment landscape for patients with relapsed or refractory hematological malignancies. Meanwhile, stem cell therapies are being employed in managing conditions ranging from multiple sclerosis and spinal cord injuries to cardiac and musculoskeletal disorders.
The U.S. has firmly positioned itself as a global leader in cell therapy, not only due to its scientific expertise but also through the presence of advanced manufacturing facilities, supportive regulatory mechanisms (e.g., the FDA’s expedited pathways), and significant funding from government and private investors. As of 2025, the country accounts for the majority of ongoing clinical trials and therapy approvals, supported by a robust pipeline of academic, pharmaceutical, and biotech stakeholders.
Despite the market’s promise, it also grapples with challenges such as high manufacturing costs, scalability issues, and regulatory hurdles. However, sustained innovation and public-private collaborations continue to address these barriers, keeping the U.S. market on an upward trajectory.
Major Trends in the U.S. Cell Therapy Market
-
Rapid Expansion of CAR-T Cell Therapy: CAR-T therapies are gaining traction beyond hematological cancers, with numerous trials exploring their use in solid tumors such as glioblastoma, pancreatic cancer, and prostate cancer.
-
Growth in Off-the-Shelf Allogeneic Products: Allogeneic, donor-derived cell therapies are being increasingly developed to overcome the logistical and cost limitations of autologous therapies.
-
Adoption of Combination Therapies: Cell therapies are being tested in conjunction with checkpoint inhibitors, chemotherapy, or radiation to enhance treatment response.
-
Technological Advancements in Cell Engineering: CRISPR-Cas9 and other gene-editing technologies are being used to enhance the efficacy, persistence, and safety of therapeutic cells.
-
Increase in FDA Approvals and Fast-Track Designations: Regulatory bodies are accelerating review and approval processes for promising therapies, with programs like the RMAT designation encouraging innovation.
-
AI Integration in Cell Therapy Development: Artificial intelligence is being deployed to optimize cell culture conditions, predict therapy responses, and streamline patient selection.
-
Emergence of Cell Banking Services: Companies are offering long-term storage of healthy cells for future therapeutic use, particularly in autologous applications.
U.S. Cell Therapy Market Report Scope
| Report Attribute |
Details |
| Market Size in 2026 |
USD 5.12 Billion |
| Market Size by 2035 |
USD 25.85 Billion |
| Growth Rate From 2026 to 2035 |
CAGR of 19.84% |
| Base Year |
2025 |
| Forecast Period |
2026 to 2035 |
| Segments Covered |
Therapy type, therapeutic area |
| Market Analysis (Terms Used) |
Value (USD Million/Billion) or (Volume/Units) |
| Report Coverage |
Revenue forecast, company ranking, competitive landscape, growth factors, and trends |
| Key Companies Profiled |
Gilead Sciences, Inc.; Selecta Bioscience; Bristol-Myers Squibb Company; CARGO Therapeutics, Inc.; Johnson & Johnson; Atara Biotherapeutics, Inc; Nkarta, Inc; Cellular Biomedicine Group, Inc; Vertex Pharmaceuticals Incorporated; Aurion Biotech |
Key Market Driver: Unmet Medical Needs and Personalized Medicine Demand
One of the most powerful drivers propelling the U.S. cell therapy market is the growing need for personalized treatments in areas with limited therapeutic options. Diseases like relapsed leukemias, certain dermatological conditions, and chronic autoimmune disorders often fail to respond to conventional treatments. Cell therapies offer a paradigm shift by addressing the root causes at the cellular level.
Take, for instance, CAR-T therapies used for treating B-cell acute lymphoblastic leukemia (B-ALL) in pediatric and adult populations. Traditional chemotherapy often results in relapse, whereas a single infusion of genetically engineered T-cells has shown remission rates upwards of 80% in trials. Similarly, autologous stem cell therapies are being used in clinical trials for degenerative disorders like ALS and Parkinson’s, where standard pharmacological treatments provide only symptomatic relief.
This personalized approach, where treatments are customized for each patient, aligns with the broader trend of precision medicine, creating robust demand for cell therapy development and delivery infrastructure across the U.S.
Key Market Restraint: Manufacturing and Cost Complexities
While the potential of cell therapy is extraordinary, the market faces a significant hurdle in the form of complex manufacturing protocols and high costs. These therapies often require highly controlled environments, individualized production processes, and advanced storage logistics, especially for autologous treatments that involve processing a patient’s own cells.
The cost of producing CAR-T therapies, for example, can exceed $400,000 per patient, excluding hospital stay and monitoring costs. The manufacturing process is multi-step, involving leukapheresis, cell engineering, expansion, quality testing, cryopreservation, and reinfusion. Any failure in quality at one step may require restarting the entire process, driving up both cost and turnaround time.
Additionally, manufacturing scalability remains an issue, particularly for therapies targeting large patient populations. Unlike small molecules, which are produced in bulk, each batch of autologous therapy must be made for a single patient. While automation and AI-driven bioprocessing offer some relief, the challenge of balancing quality, cost, and scale persists.
Key Market Opportunity: Expansion of Allogeneic Therapies
A compelling opportunity in the U.S. cell therapy market lies in the expansion and maturation of allogeneic (donor-derived) therapies. Unlike autologous therapies that use a patient’s own cells, allogeneic approaches use cells from healthy donors, enabling mass production and off-the-shelf availability. This model significantly reduces manufacturing timelines, costs, and logistical complications.
Several biotech firms, including Allogene Therapeutics and Fate Therapeutics, are developing universal donor cells through advanced gene-editing techniques to prevent immune rejection. These therapies are being tested in both hematologic and solid tumors and show promising safety and efficacy results.
The potential scalability of allogeneic therapies makes them a game-changer, especially for acute or widespread conditions requiring rapid intervention. Their utility also extends to dermatological and musculoskeletal diseases where a timely therapeutic window can significantly influence outcomes. As clinical data and regulatory confidence grow, allogeneic products are expected to account for a larger share of the cell therapy market.
U.S. Cell Therapy Market Segmental Insights
By Therapy Type Insights
Autologous therapies dominated the U.S. cell therapy market by therapy type. These therapies, especially T-cell based immunotherapies like CAR-T and TCR-based products, have led the charge in clinical efficacy and FDA approvals. CAR-T cell therapy has gained rapid clinical and commercial acceptance in treating hematological malignancies such as B-ALL and diffuse large B-cell lymphoma. The advantage of using the patient's own cells reduces the risk of rejection, thereby improving treatment specificity. Despite their complexity, the clinical success of products such as Kymriah and Abecma continues to reinforce the dominance of autologous therapies.
Allogeneic therapies are the fastest-growing segment, particularly stem cell therapies and keratinocyte/fibroblast-based applications. Mesenchymal stem cells (MSCs), derived from bone marrow or umbilical cord blood, are increasingly being used in orthopedic and autoimmune disease trials. Their immunomodulatory and anti-inflammatory effects open avenues for applications across multiple disease areas. Additionally, keratinocyte and fibroblast-based therapies are gaining traction for chronic wound healing, burn repair, and reconstructive surgery. The ability to manufacture these therapies in bulk for wider distribution gives this segment scalability and commercial viability.
By Therapeutic Area Insights
Oncology dominates the U.S. cell therapy market by therapeutic area. The use of immune cell therapies primarily CAR-T cells in hematologic cancers has significantly improved patient outcomes, leading to high demand from both patients and providers. The FDA has granted approval to six CAR-T therapies as of 2025, including Tecartus and Breyanzi, with more in the pipeline for both blood cancers and solid tumors. Clinical trials in non-small cell lung cancer, triple-negative breast cancer, and pancreatic cancer are expanding the scope of oncological cell therapy applications.

Dermatology is one of the fastest-growing segments. With the rise in chronic dermatological conditions such as non-healing wounds, burns, vitiligo, and psoriasis, cell therapies like fibroblast transplantation and engineered skin grafts are gaining ground. For example, the approval of products such as Laviv (an autologous fibroblast therapy for smile lines) highlighted dermatology as a viable domain for cellular applications. Moreover, the cosmetic and regenerative dermatology industry in the U.S. is robust, opening up opportunities for aesthetic and anti-aging cell-based treatments.
Country-Level Insights
The United States is the epicenter of global cell therapy innovation, accounting for the largest share of R&D activity, clinical trials, and approved cell therapies. Major biopharma hubs like Boston, San Diego, and the Bay Area house hundreds of startups, academic medical centers, and CDMOs working collaboratively to accelerate therapeutic development. U.S.-based institutions such as the National Institutes of Health (NIH), MD Anderson Cancer Center, and Mayo Clinic are heavily involved in cell therapy research and clinical translation.
Regulatory frameworks in the U.S. are relatively progressive. The FDA has introduced several expedited review mechanisms for regenerative therapies, including the Regenerative Medicine Advanced Therapy (RMAT) designation and Breakthrough Therapy designation. These have helped fast-track approvals for transformative therapies and encouraged innovation.
Moreover, U.S. payers are gradually adapting to cover high-cost cell therapies through value-based pricing models and outcomes-based reimbursement. For instance, CMS has created specific reimbursement pathways for CAR-T treatments. Additionally, public and private investment continues to pour into the sector, with over $5 billion in venture capital directed toward cell and gene therapy startups in 2024 alone.
Recent Developments
-
April 2025: Allogene Therapeutics announced positive Phase 2 data for its allogeneic CAR-T product ALLO-501A for treating relapsed non-Hodgkin lymphoma, showcasing durable responses and minimal toxicity.
-
March 2025: Gilead Sciences (through its Kite Pharma unit) began construction of a new CAR-T manufacturing facility in Maryland to support commercial demand for Yescarta and Tecartus.
-
February 2025: Fate Therapeutics reported progress in its off-the-shelf natural killer (NK) cell program, receiving an IND clearance from the FDA to initiate trials for solid tumors.
-
January 2025: Novartis received FDA approval for a label expansion of Kymriah to include earlier lines of therapy in adult B-cell acute lymphoblastic leukemia.
-
December 2024: Vericel Corporation, a leader in autologous cell therapies for sports medicine and burn care, expanded its U.S. manufacturing footprint in Massachusetts to meet increasing demand.
Some of the prominent players in the U.S. Cell Therapy Market include:
Segments Covered in the Report
This report forecasts revenue growth at country levels and provides an analysis of the latest industry trends in each of the sub-segments from 2021 to 2035. For this study, Nova one advisor, Inc. has segmented the U.S. Cell Therapy market.
By Therapy Type
- Allogeneic Therapies
- Stem Cell Therapies
- Hematopoietic Stem Cell Therapies
- Mesenchymal Stem Cell Therapies
- Non-Stem Cell Therapies
- Keratinocytes & Fibroblast-based Therapies
- Others
- Autologous Therapies
- T-Cell Therapies
- CAR T Cell Therapy
- T Cell Receptor (TCR)-based
- Others
By Therapeutic Area
- Oncology
- Dermatology
- Others


